


The XLM price has risen relatively little since it hit the low point at around $ 0.1. Will the XLM course recover now?
The XLM price was bearishly rejected at the Golden Ratio resistance
The XLM price rose to around $ 0.1385 after establishing a low point at around $ 0.1. It was then rejected bearishly at the Golden Ratio at around $ 0.135, after which the XLM price returned to the 50-day EMA at around $ 0.12. The XLM price has been able to bounce bullish on this so far and Stellar could now make its way to the golden Ratio at around $ 0.135 again.
If Stellar Lumens breaks the Golden Ratio resistance, the next significant resistance to Stellar is waiting between $ 0.153 and $ 0.165, because Stellar encounters the 0.382 Fib resistance and the 200-day EMA there.
Furthermore, the MACD is rather bearish on the daily chart. The MACD lines are still crossed bullish, but the histogram has been ticking bearishly lower for a few days. The RSI is neutral.
The XLM course could establish a death cross in the weekly chart
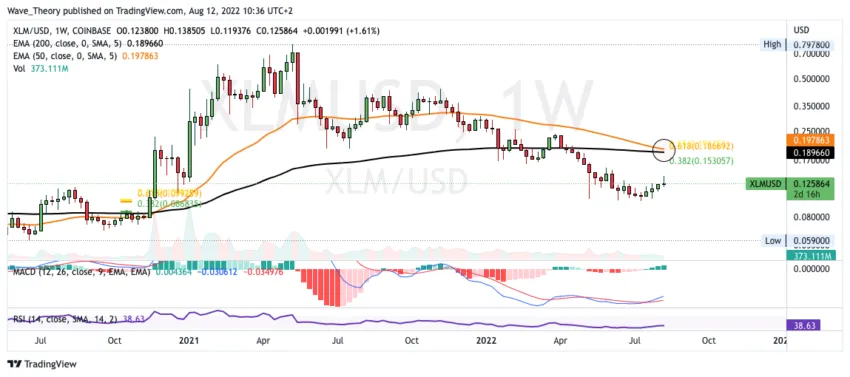
In the weekly chart, the histogram of the MACD has been ticking bullish higher for weeks and the MACD lines have also crossed bullish. Nevertheless, the EMAs are getting dangerously close, with which they could establish a death cross. This would confirm the bearish trend in the medium term. In contrast to these bullish and bearish signals, the RSI is also neutral here.
Is history repeating itself for Stellar Lumens?
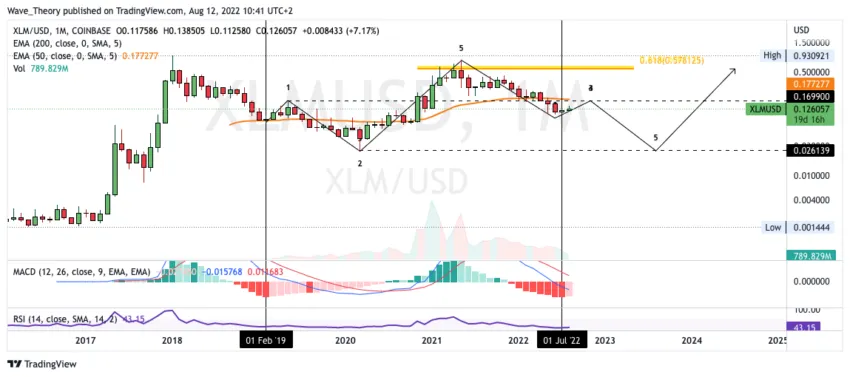
In the monthly chart, the histogram of the MACD begins to tick bullish higher this month. The last time this happened after a long downtrend, the XLM price established a local high point at around $ 0.17, only to fall even lower afterwards. The XLM price fell to around 0.026 USD and thus lost an enormous price loss. Subsequently, the XLM price rose to the golden ratio at around 0.58 USD in the course of the last bull run.
Interestingly, at this local high point, the 50-month EMA is around $ 0.17, which acts as a significant resistance. In fact, history could repeat itself and the Stellar Lumens price reaches $ 0.17, in order to subsequently fall even lower and find a bottom.
As a result, the Stellar Lumens price could open up to the Golden Ratio at around $ 0.58, the break of which is fundamentally decisive for the further course of the price. Because without the break of the Golden Ratio at around $ 0.58, Stellar Lumens is inevitably in a long-term downtrend.
On the other hand, if the Stellar Lumens price breaks the 50-month EMA bullish and closes above it this month, this scenario is unlikely and Stellar could then have found a bottom at around $ 0.1.
Against BTC, the MACD is bullish on the monthly chart
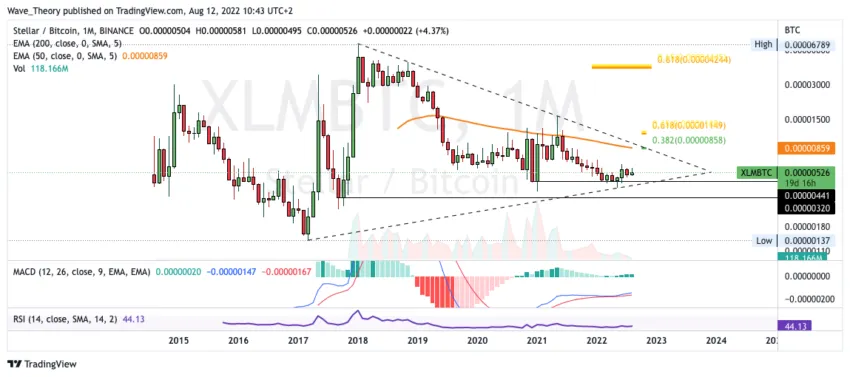
Against BTC, the MACD is clearly bullish on the monthly chart. Thus, the histogram has been ticking bullish higher for several months and the MACD lines have also crossed bullish. The RSI is neutral.
The Stellar Lumens price is located in a symmetrical triangle, where the 50-month EMA and the 0.382 Fib level mark the upper resistance, the break of which would entail a bullish breakout. If the XLM price breaks the resistance at around 0.0000086 BTC bullish, Stellar could rise to around 0.000012 BTC.
Between 0.0000032 and 0.0000044 BTC significant support is waiting for the Stellar Lumens price.
Disclaimer
All information contained on our website is researched to the best of our knowledge and belief. The journalistic articles are for general information purposes only. Any action taken by the reader on the basis of the information found on our website is done exclusively at his own risk.