

Is the Cardano price now rising to 1 USD? The ADA price is on the verge of a bullish breakout and could rise sharply in the course of it.
The Cardano price is in a bullish price pattern
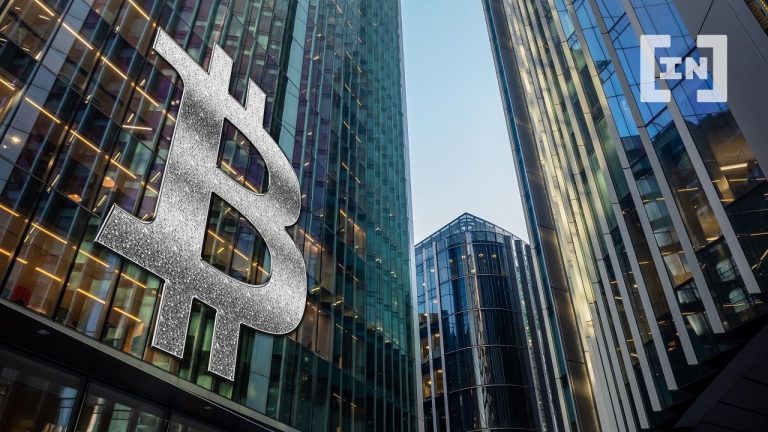
The Cardano price is in a bullish price pattern; an ascending triangle. Finally, the Cardano price forms a series of higher lows and is on the verge of breaking the Golden Ratio resistance bullish at around $ 0.58.
If Cardano breaks out bullish, the ADA price could rise around 30% to reach the next Fib level at around $ 0.72. In addition, the 200-day EMA acts as additional resistance at around $ 0.76.
In addition, the histogram of the MACD ticks bullish higher in the daily chart and the MACD lines are also crossed bullish. The RSI is neutral and is gradually reaching overbought regions.
Will the Cardano price rise to 1 USD?
In the medium term, the Cardano price could rise to around 1 USD, but the ADA price is already expecting fierce resistance at around 0.92 USD. This is where the Cardano price encounters Golden Ratio resistance and the 50-week EMA.
In the medium term, it looks very bullish for Cardano, especially if the weekly candle closes above the 200-week EMA at around $ 0.54. After all, the MACD’s histogram has been ticking bullish higher for weeks and the MACD lines have also crossed bullish. The RSI is also neutral here.
50-Month EMA has already been overcome
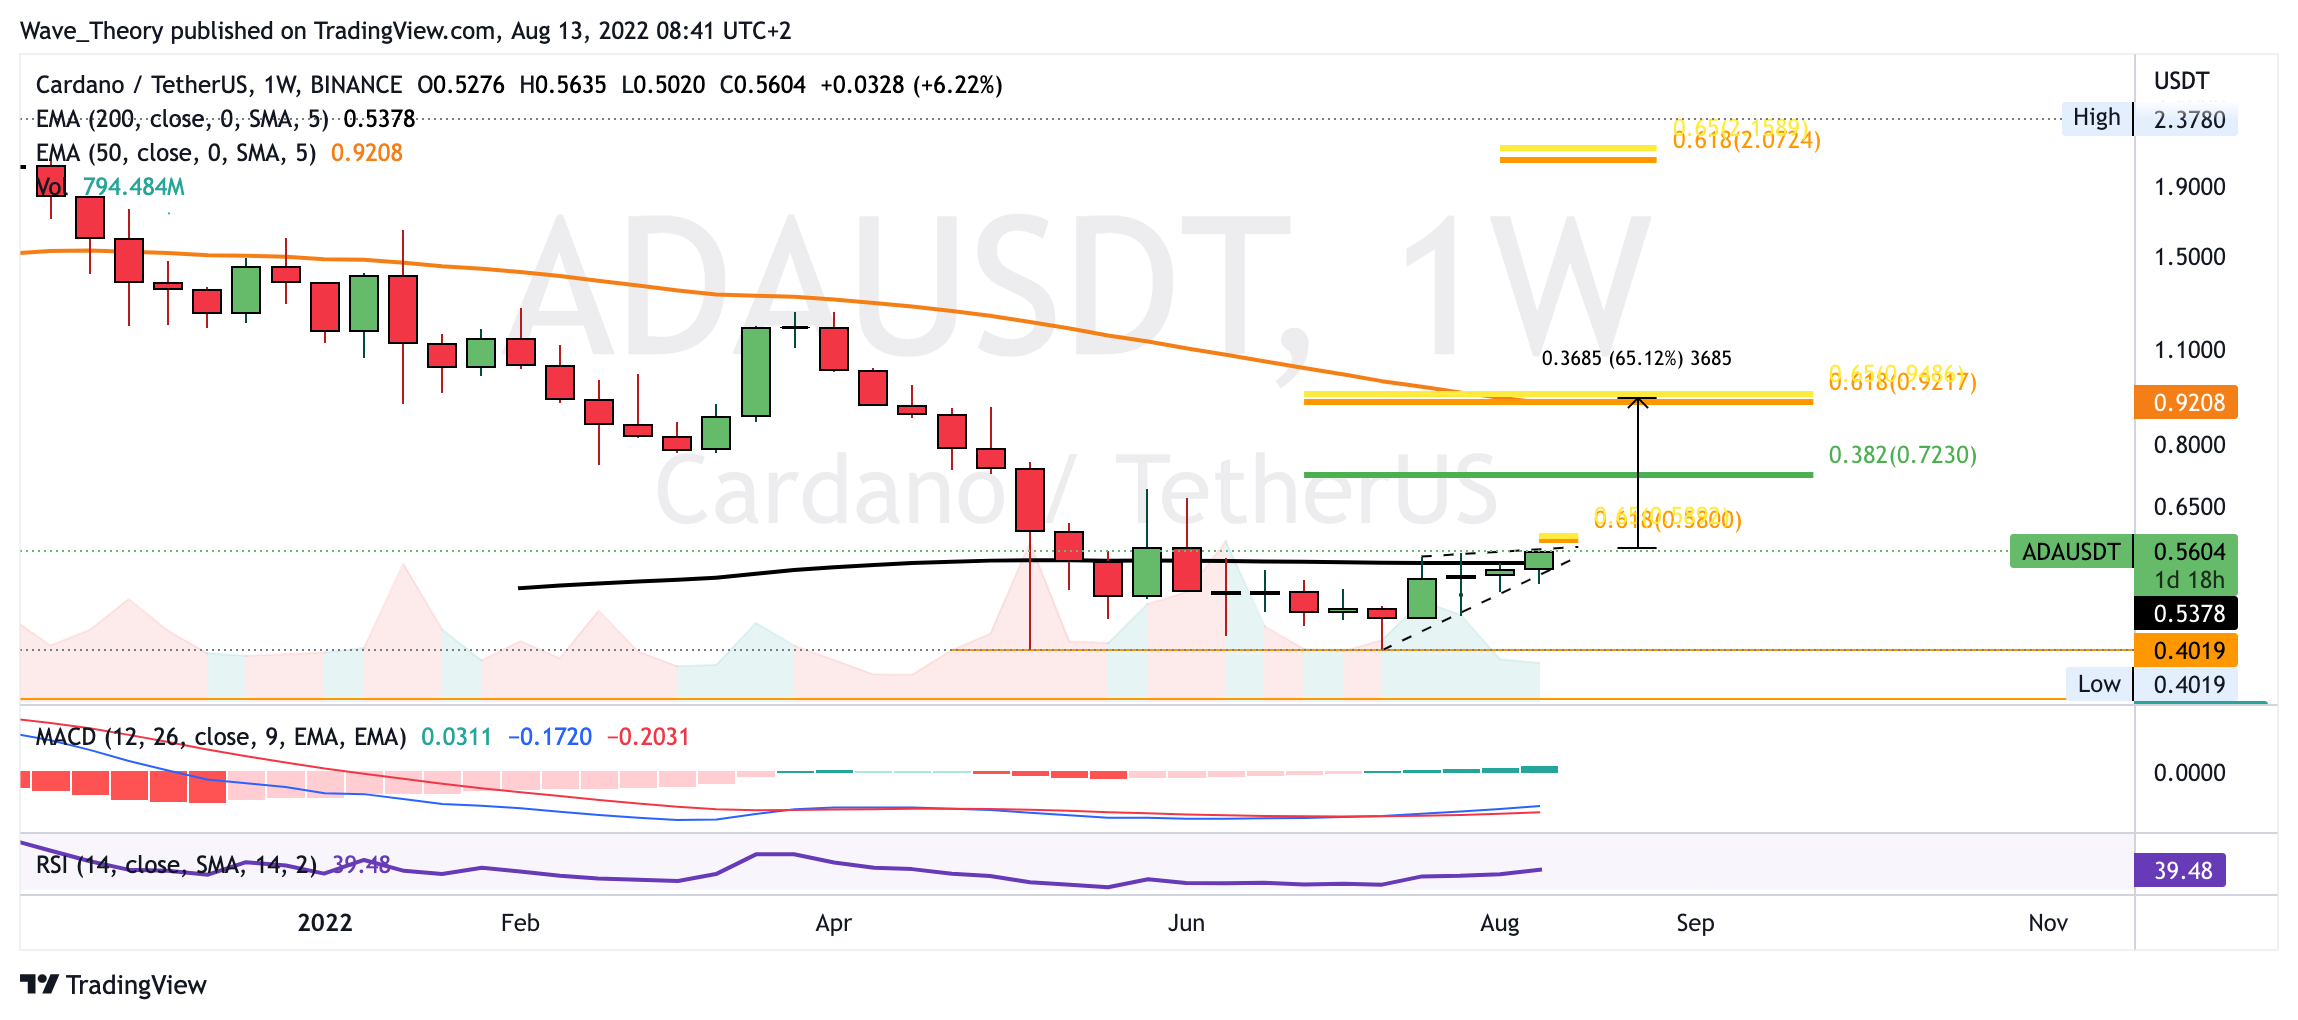
On the monthly chart, the MACD’s histogram is ticking bullish higher this month, which could mark the beginning of a bullish trend reversal. The ADA price has already been able to overcome the 50-month EMA at around USD 0.517. A monthly close above the 50-month EMA would indicate a continuation of the upward movement. On the other hand, a monthly close below that would be very bearish.
For a completely bullish trend reversal, the ADA price must overcome the Golden Ratio resistance at around 2.1 USD.
Against BTC, the ADA price is moving between two Fib levels
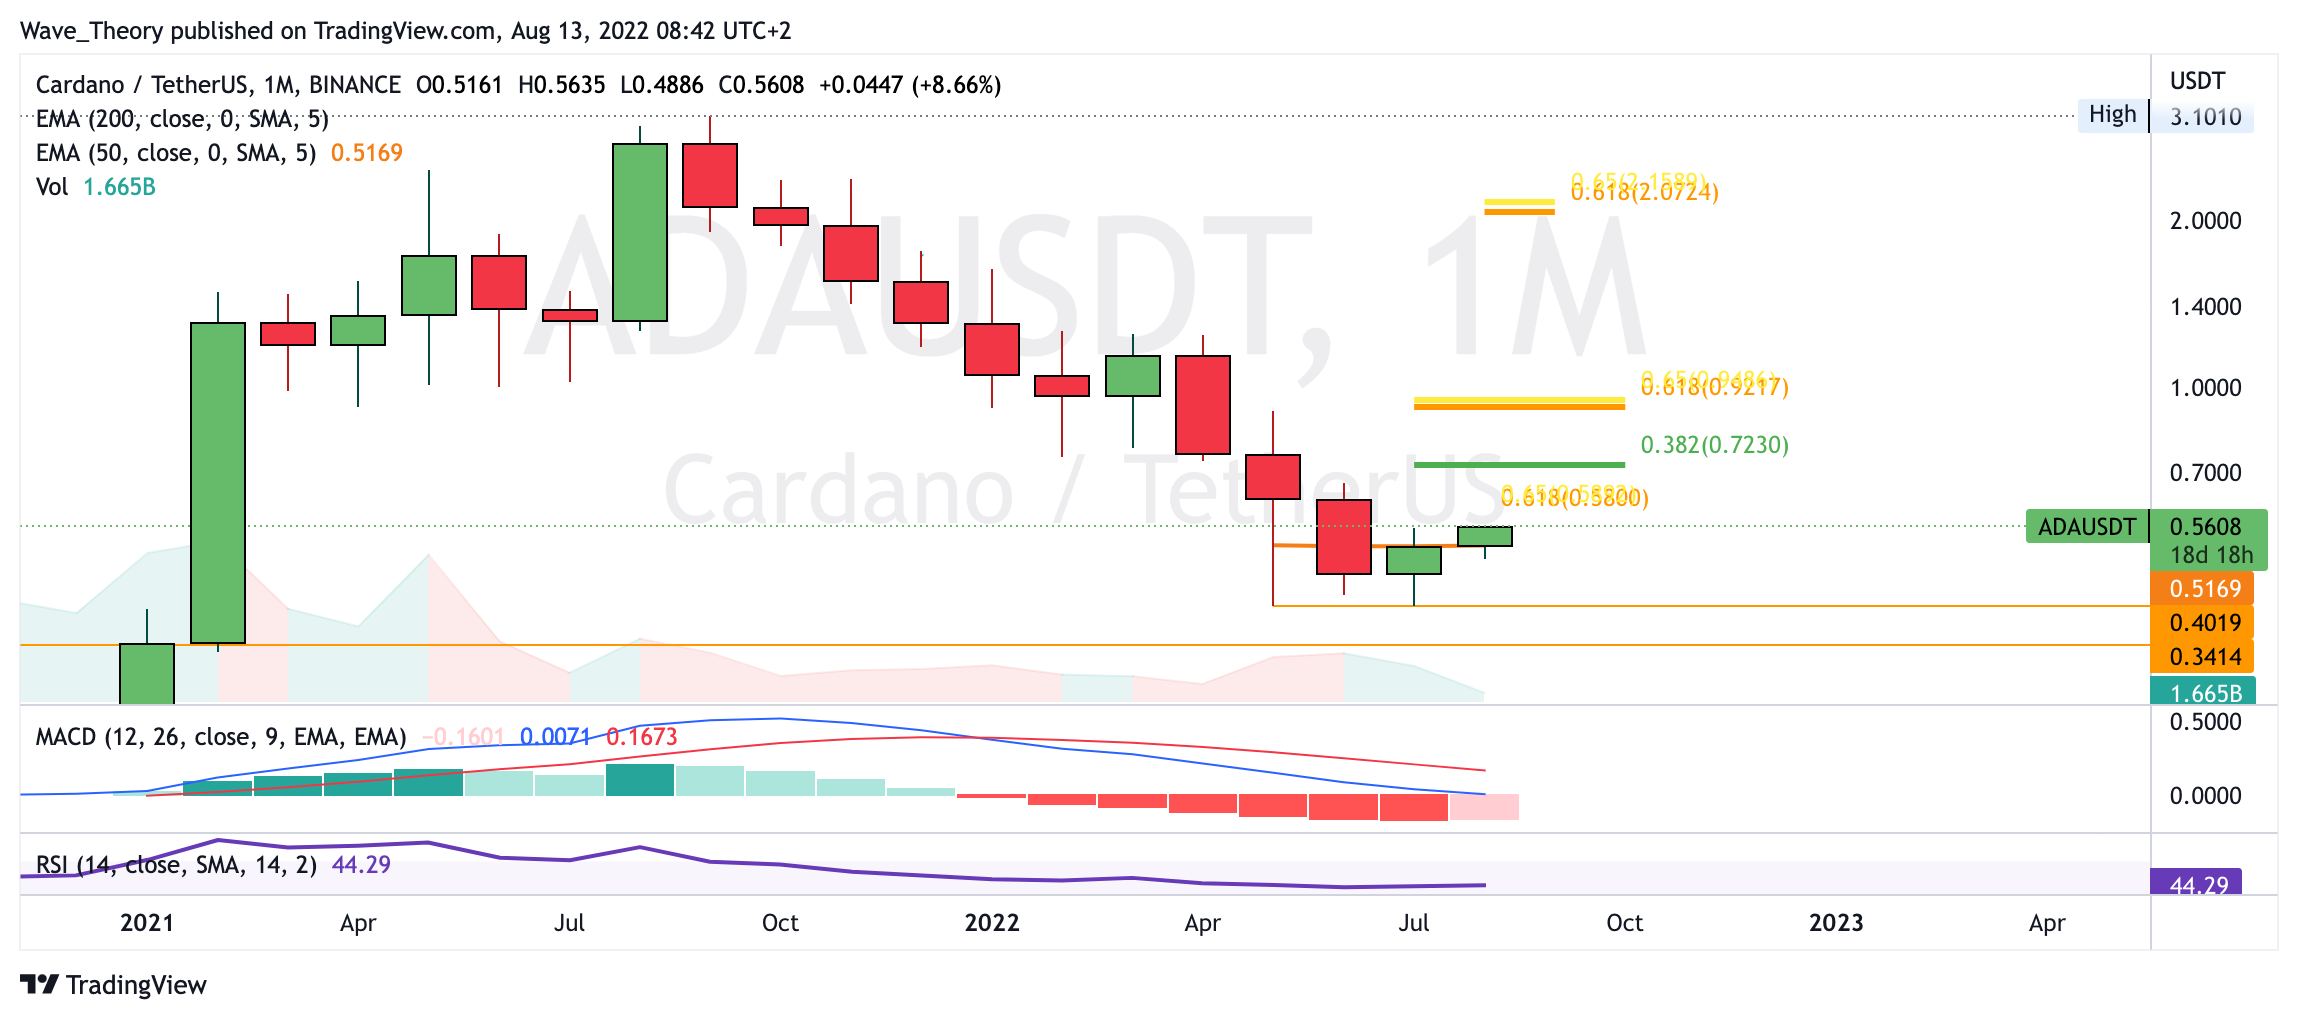
Against BTC, the ADA price has been moving up the last few days, moving between the 0.382 Fib resistance at around 0.00024 BTC and the 0.382 Fib support at around 0.00021 BTC. The MACD’s histogram has been ticking bullish higher for months. Currently, it looks as if the ADA price is moving again to the 0.382 Fib resistance at around 0.00024 BTC.
Here is the last Cardano course forecast.
Disclaimer
All information contained on our website is researched to the best of our knowledge and belief. The journalistic articles are for general information purposes only. Any action taken by the reader on the basis of the information found on our website is done exclusively at his own risk.