


The Ethereum price has finally picked up the price target of around 1.912 USD, which has been discussed for months. Now the ETH price could rise even higher!
Ethereum price reaches the price target at around 1.912 USD
The Ethereum price has picked up the long-awaited price target at around $ 1,912. Now Ethereum is encountering significant resistance at around $2,135, because that’s where the 200-day EMA is located. The ETH exchange rate is now supported at around 1,912 USD and at the latest at the 50-day EMA at around 1,600 USD.
In the daily chart, the MACD is clearly bullish, because the histogram ticks bullish higher and the MACD lines are crossed bullish.
Is the Ethereum price now rising to the Golden Ratio resistance?
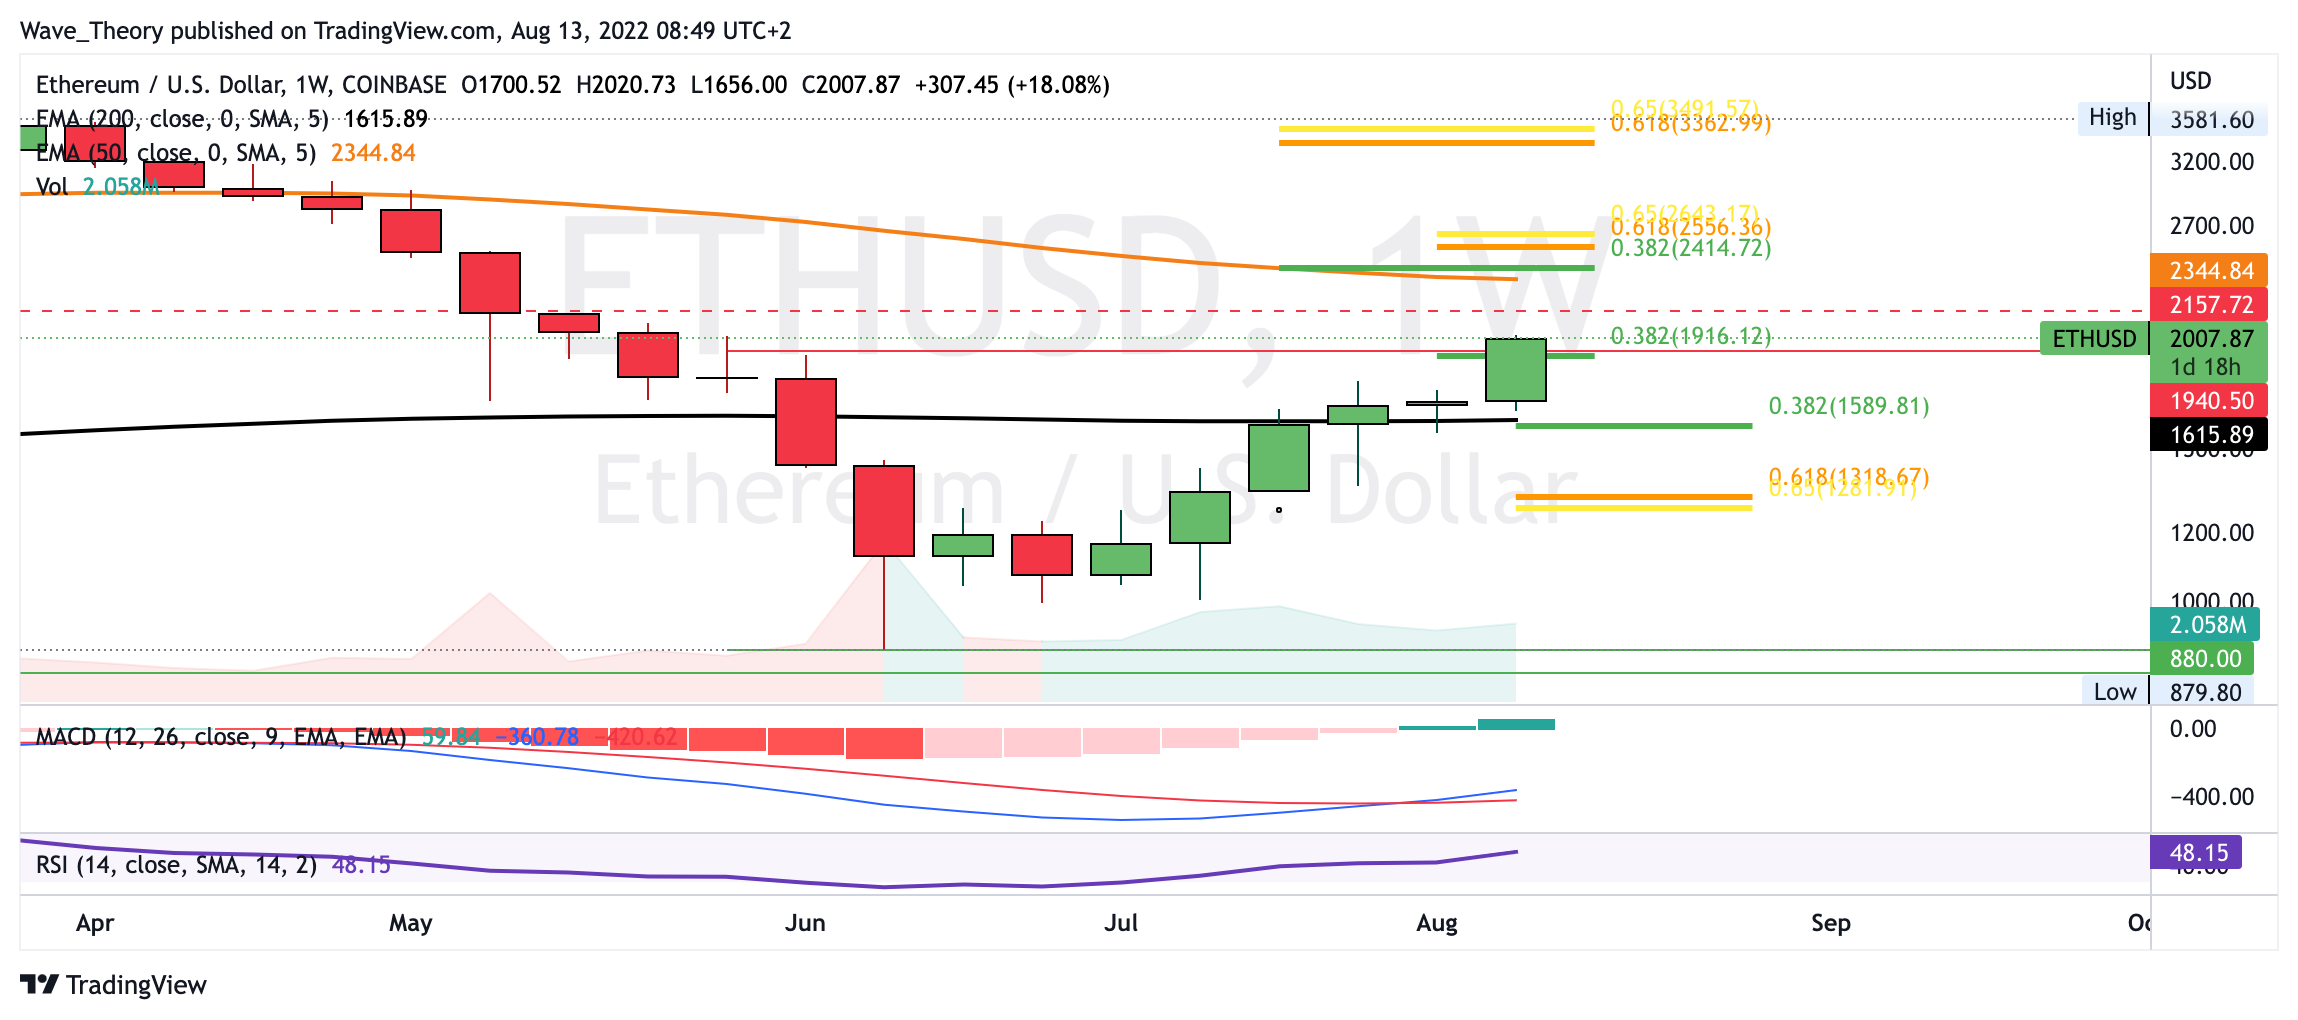
Also in the weekly chart, the histogram of the MACD ticks bullish higher and the MACD lines are crossed bullish. In both the daily and weekly charts, the RSI is neutral and gives neither bullish nor bearish signals.
If Ethereum breaks the resistance at around $ 2,135, the next significant resistance is waiting at around $ 2,400. There, Ethereum encounters the 50-week EMA and the 0.382 Fib level. If Ethereum also breaks this resistance, the Ethereum price could rise to the Golden Ratio at around $ 2,600.
A monthly close above the 50-month EMA would be bullish
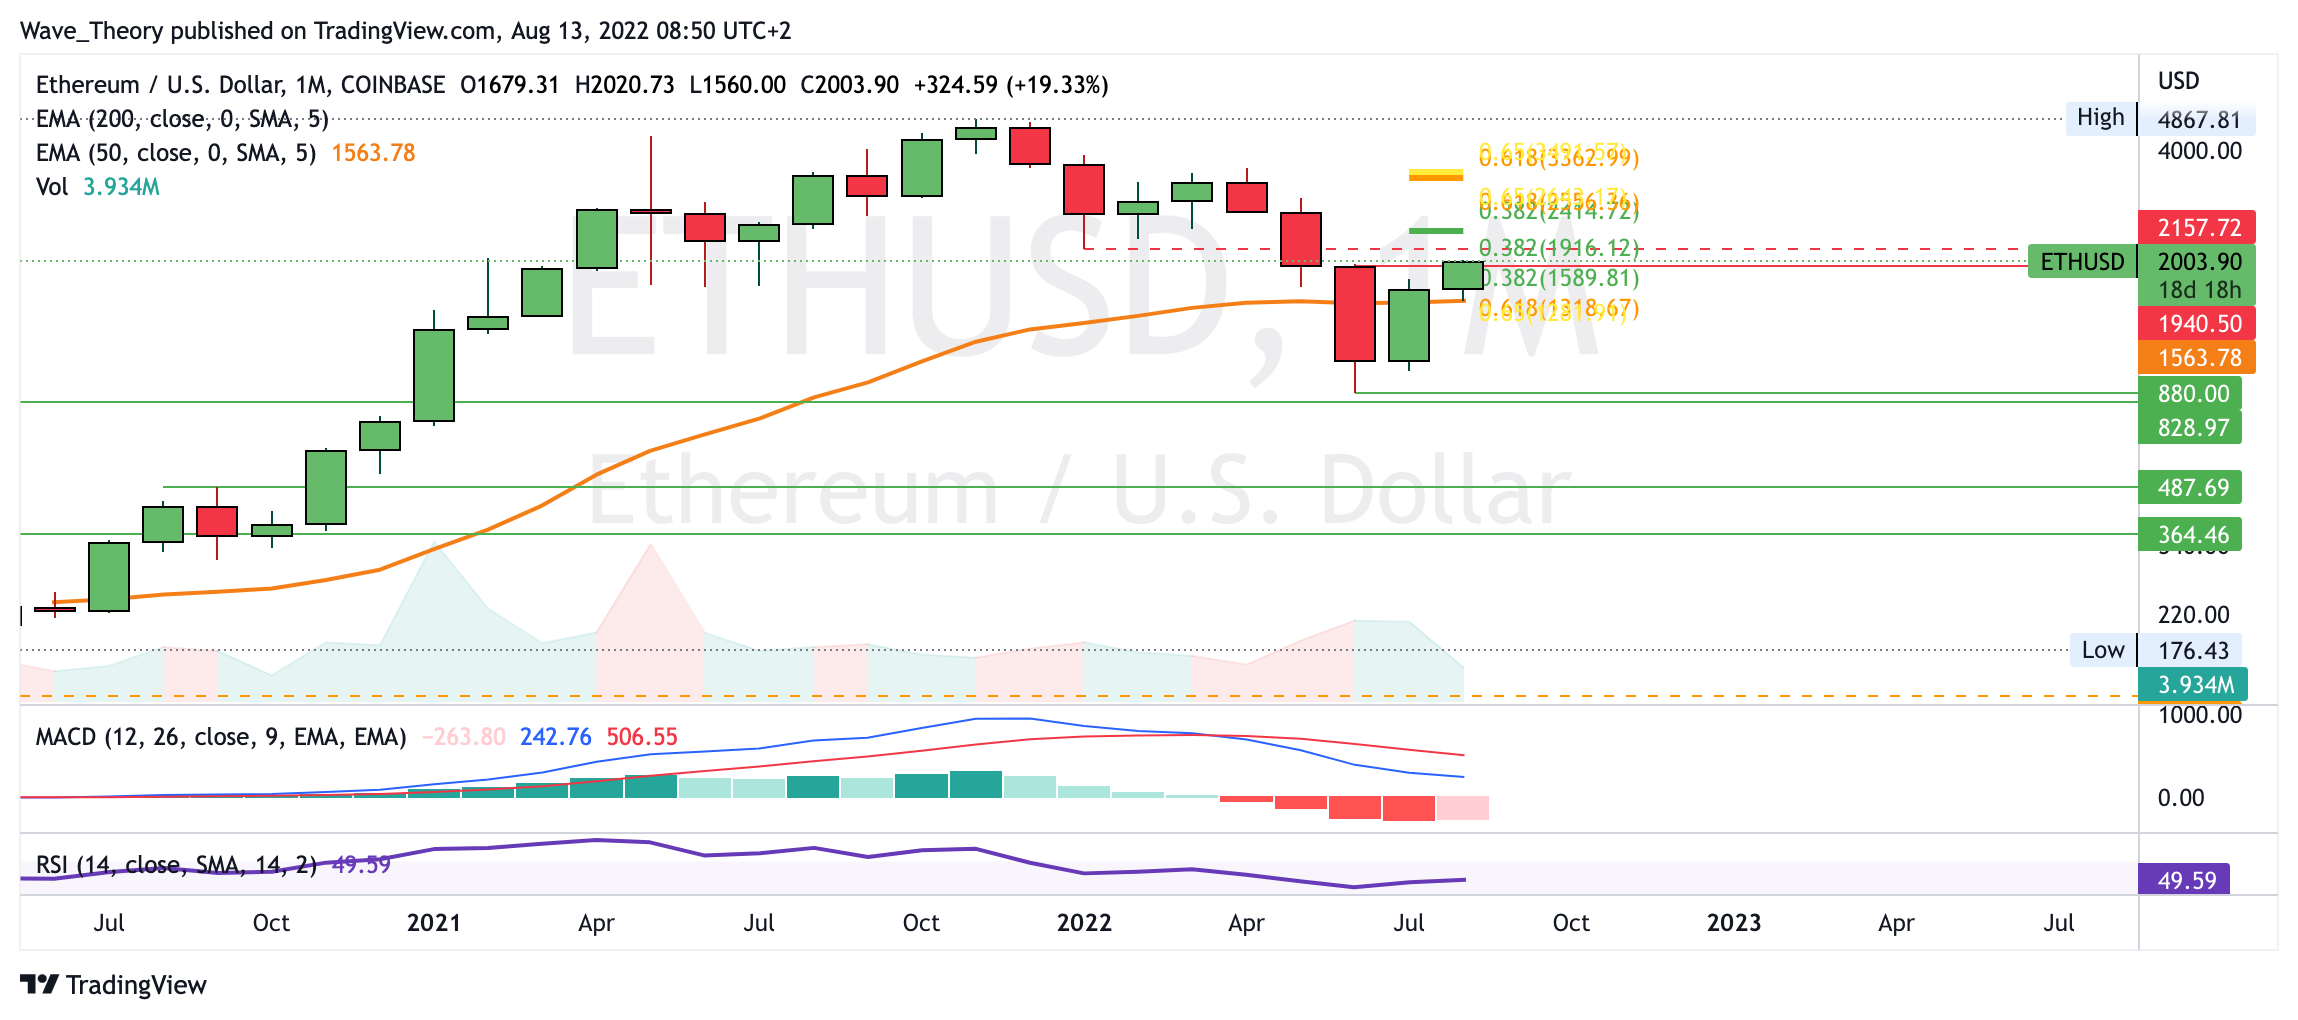
On the monthly chart, the histogram of the MACD begins to tick bullish higher this month, which gives indications of a bullish trend reversal. The decisive factor for the further course of Ethereum is how Ethereum reacts at the next Fib resistances and whether Ethereum can hold above the 50-month EMA at around $ 1,565.
In any case, a monthly close below the 50-month EMA at around $ 1,565 would be very bearish. At the moment, however, there is no reason to assume that the Ethereum price will fall sharply over the next two weeks. Instead, it looks more like a continuation of the upward movement.
For a complete bullish trend reversal, the ETH price must break the Golden Ratio at around $ 3,400. Then Ethereum can target new highs again.
Against BTC, the ETH price also reaches the bullish price target
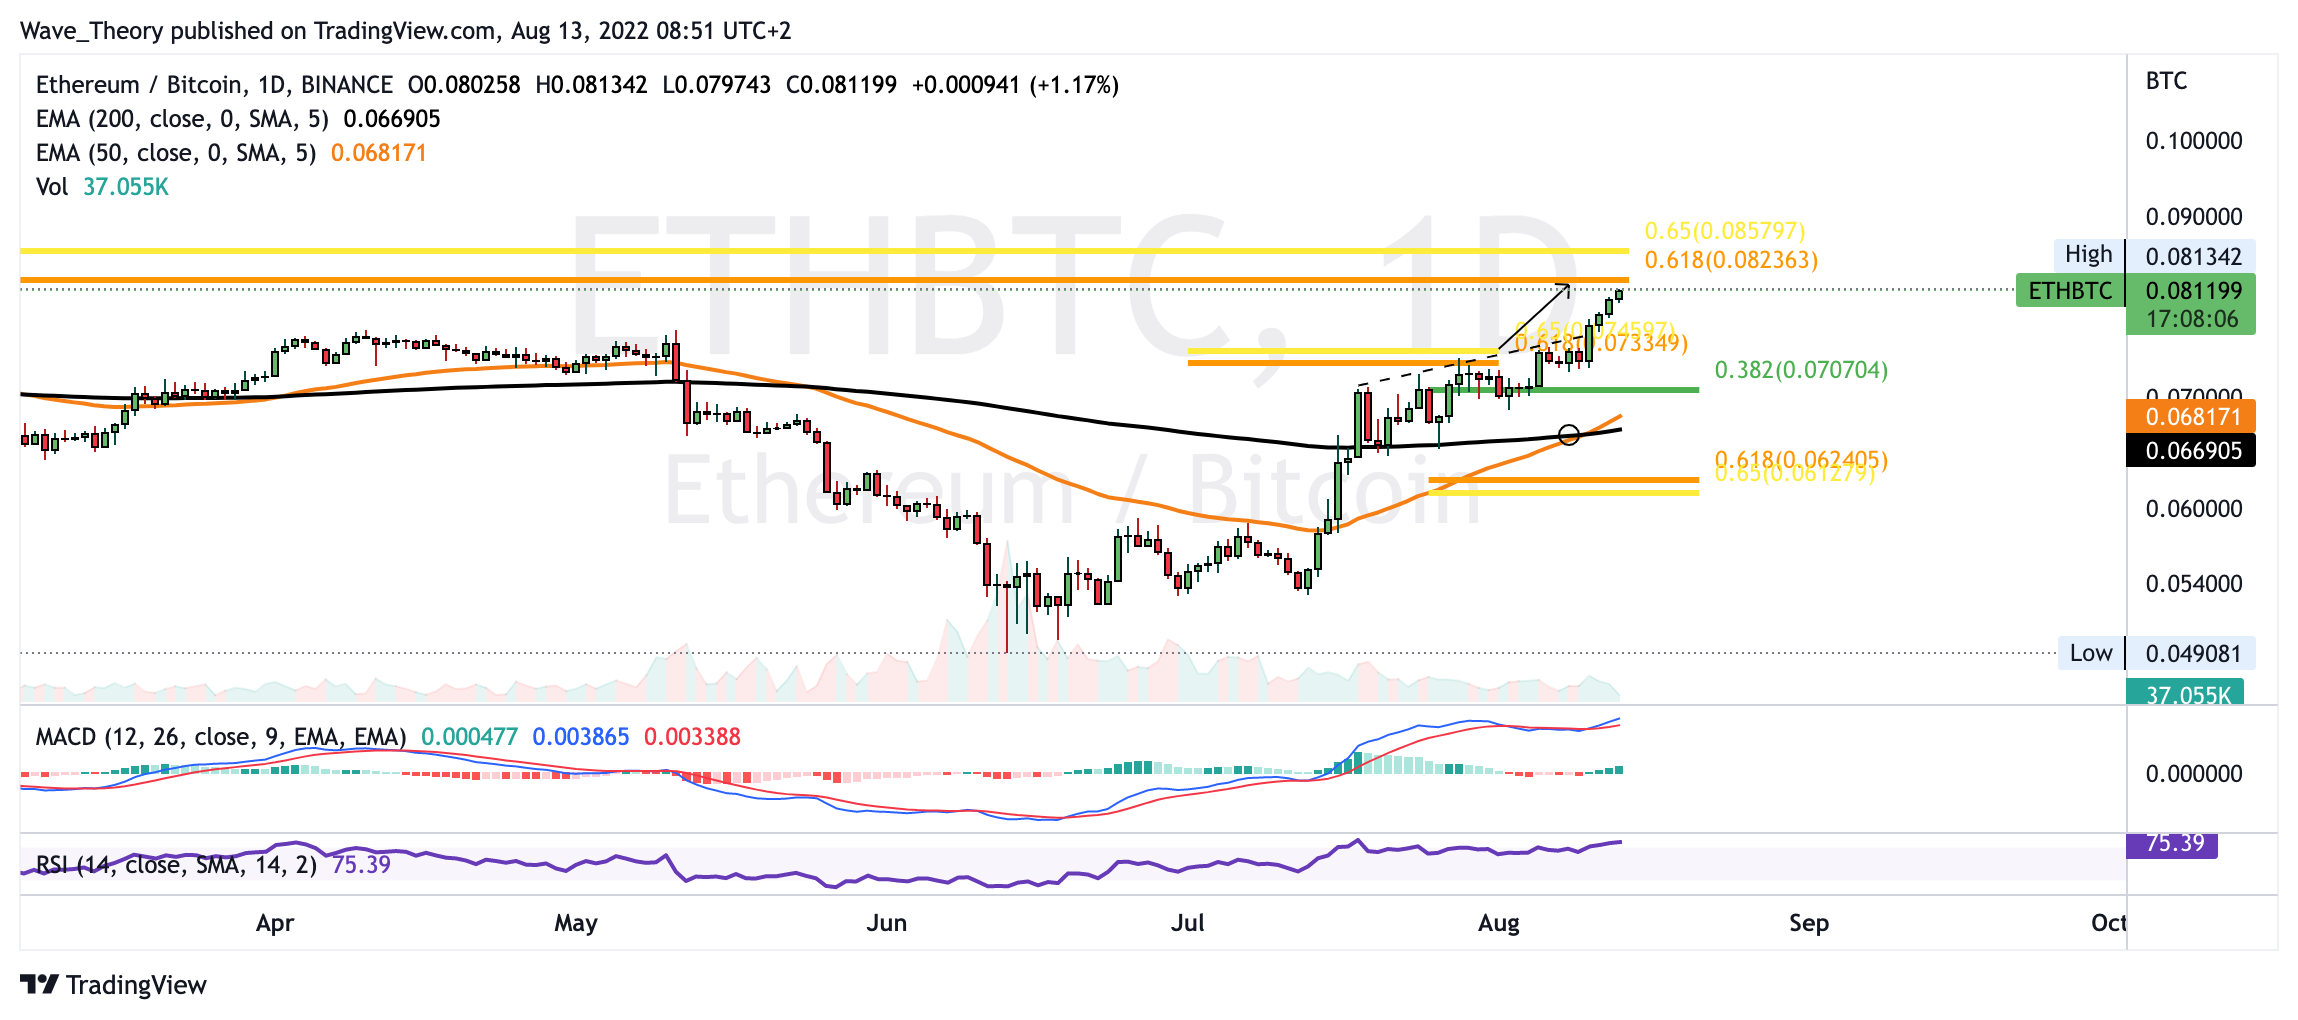
Also against BTC, the ETH price was able to reach the last price target at around 0.074 BTC and break the resistance to target the next price target of the Golden Ratio at around 0.085 BTC. If Ethereum breaks the golden ratio at around 0.085 BTC, which Ethereum even failed to do in the bull run of 2021, Ethereum could rise to the last high point from 2018 and thus reach around 0.1238 BTC.
In addition, the EMAs have a golden crossover in the daily chart, which confirms the trend bullish in the short to medium term. In addition, the MACD is also clearly bullish, because the MACD lines are crossed bullish and the histogram ticks bullish higher.
Ethereum is currently very bullish, especially compared to BTC.
Here is the last Ethereum price forecast.
Disclaimer
All information contained on our website is researched to the best of our knowledge and belief. The journalistic articles are for general information purposes only. Any action taken by the reader on the basis of the information found on our website is done exclusively at his own risk.