


The TESLA stock is currently experiencing a small bull run, because TSLA has been able to rise over 50% in recent weeks. Is TESLA’s bear market over?
TESLA shares on the way to the $1,000 mark
The last month has been extremely bullish for TESLA stock, as TSLA rose about 38% in July, giving indications of a bullish trend reversal. Since TSLA had established a low point at around 621 USD, the TSLA price has already risen above 50%.
Nevertheless, the correction phase is not over until TSLA breaks the Golden Ratio resistance at $ 1,023. If TSLA is rejected at the Golden Ratio at around USD 1,023, TSLA will thus form a lower high point again, which would confirm the bearish trend.
In the worst case, TSLA is thus forming a bearish price pattern; the head and Shoulders pattern, which could push the TSLA price to the Golden Ratio at around $ 440 in the event of a bearish breakout, with the 50-month EMA already serving as a significant support at around $ 540.
So if TSLA is rejected bearishly at the Golden Ratio at around $ 1,023, TESLA stock should not fall below the trend line at around $ 655. Otherwise, a price drop of up to 31% could occur.
On the monthly chart, however, the MACD’s histogram has been ticking bullish higher since last month. However, the MACD lines are still bearishly crossed, while the RSI has been forming a series of lower high points for months.
There could be a Golden crossover in the 4H chart
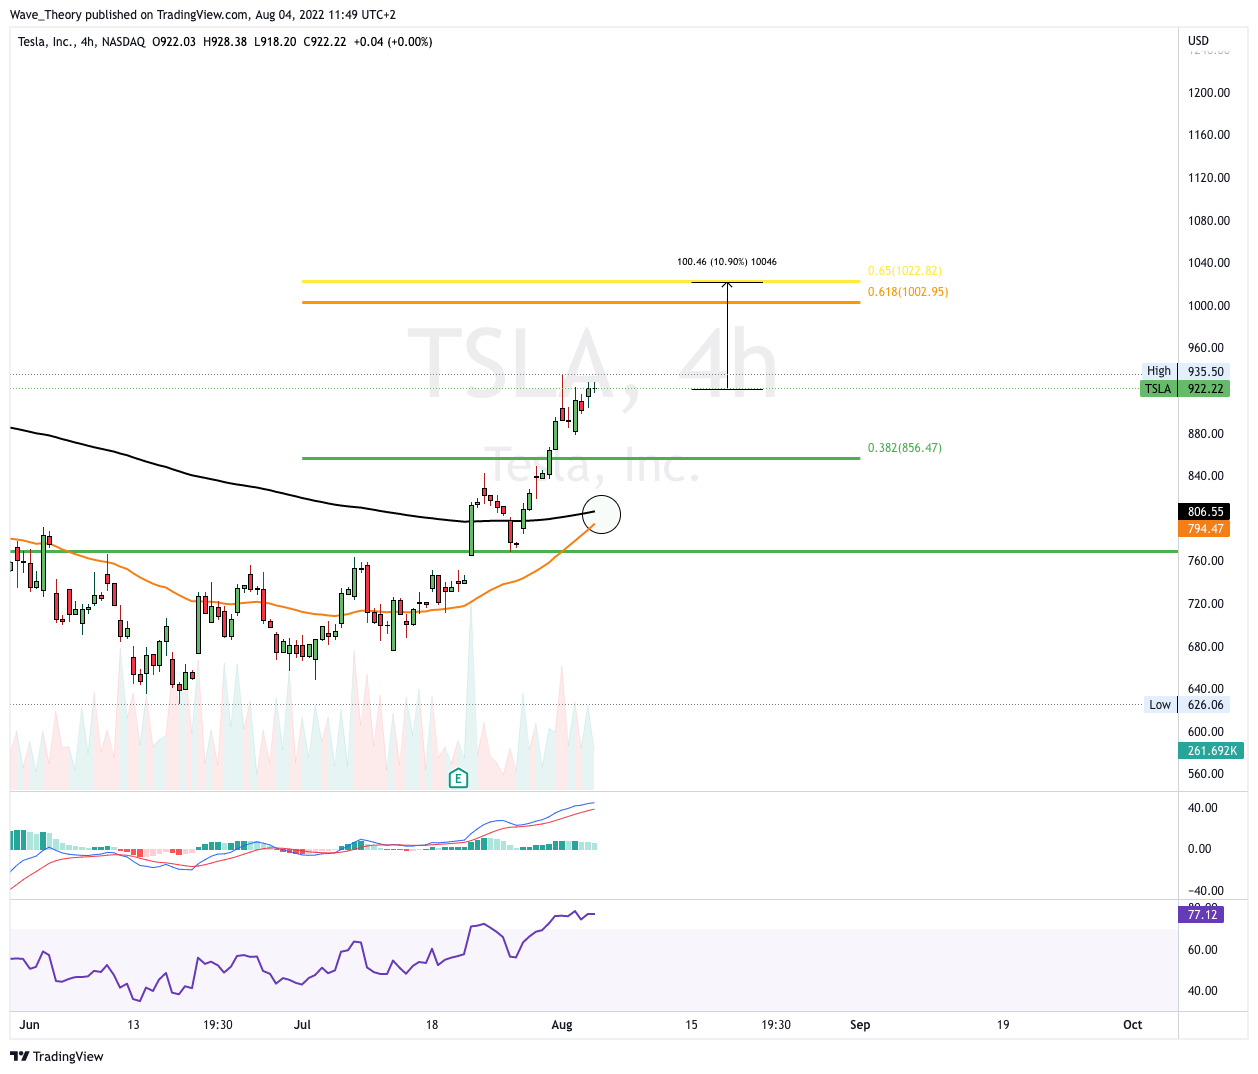
Overall, the TSLA price now still has around 11% upside potential until it encounters the decisive Fibonacci resistance between $ 1,000 and $ 1,023. The RSI is already in overbought regions, but does not show a bearish divergence. The histogram of the MACD already shows a bearish divergence, but the MACD lines are still crossed bullish.
In addition, the histogram is also ticking bearishly lower, whereas the EMAs are on the verge of a golden crossover, which would confirm the trend bullish in the short term.
Is the TSLA price reaching the all-time high?
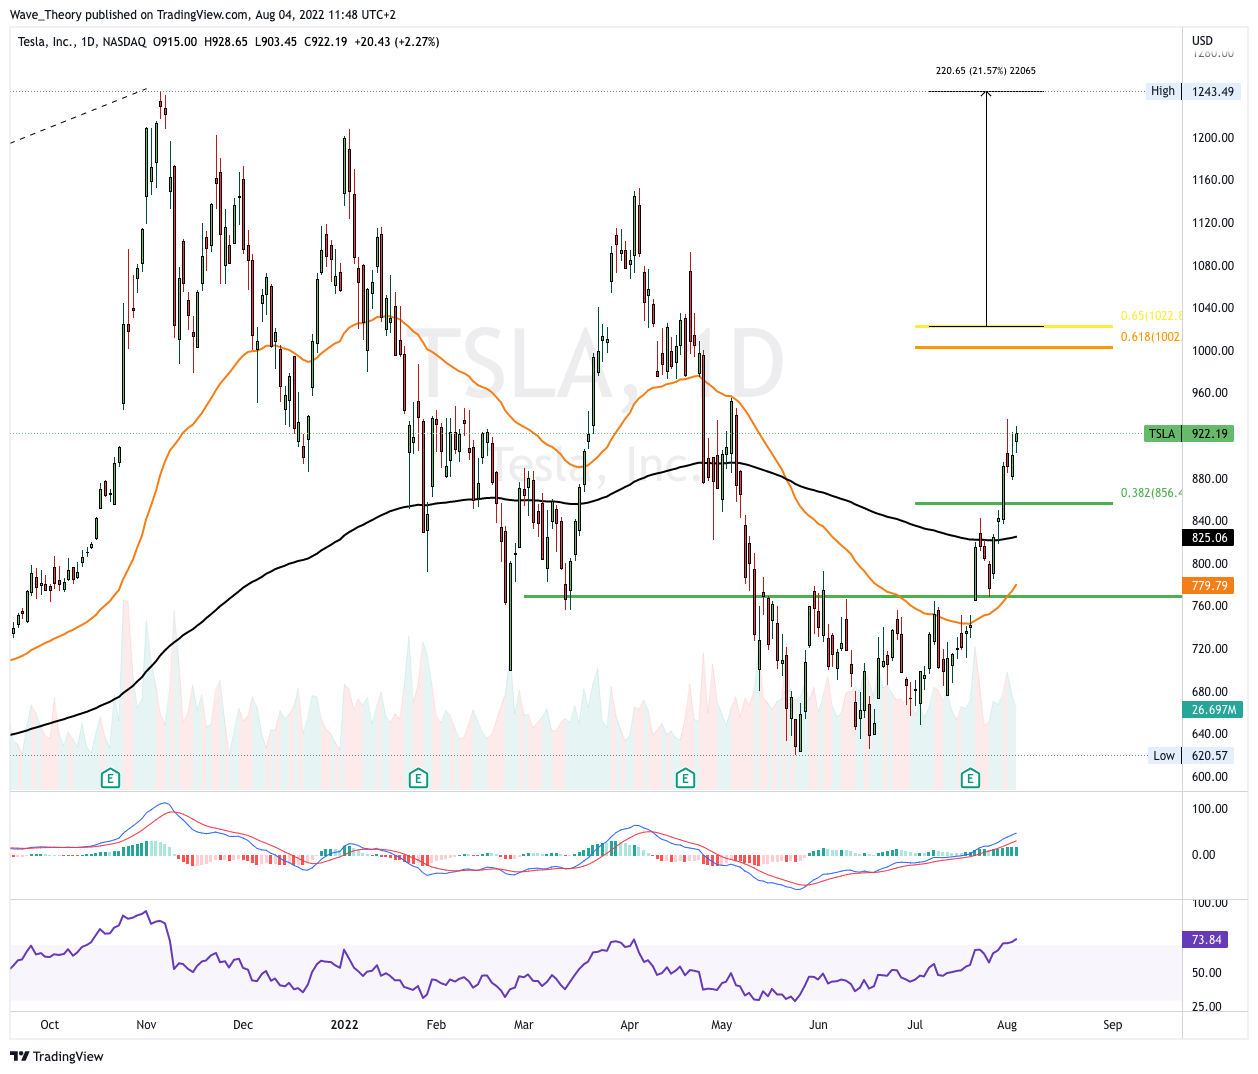
In the daily chart, the EMAs are still in a bearish death cross, which means that the trend remains bearish in the medium term. The MACD, on the other hand, is clearly bullish, because the histogram ticks bullish higher and the MACD lines are crossed bullish. The RSI moves into overbought regions, but gives neither bullish nor bearish signals.
If TSLA is rejected bearishly at the Golden Ratio at around USD 1,023, significant Fibonacci supports are already waiting for TESLA at around USD 867 and USD 765.
If TSLA breaks the Golden Ratio bullish, the next significant resistance is waiting at the ATH at around $ 1243.5.
In the weekly chart, TESLA is also clearly bullish
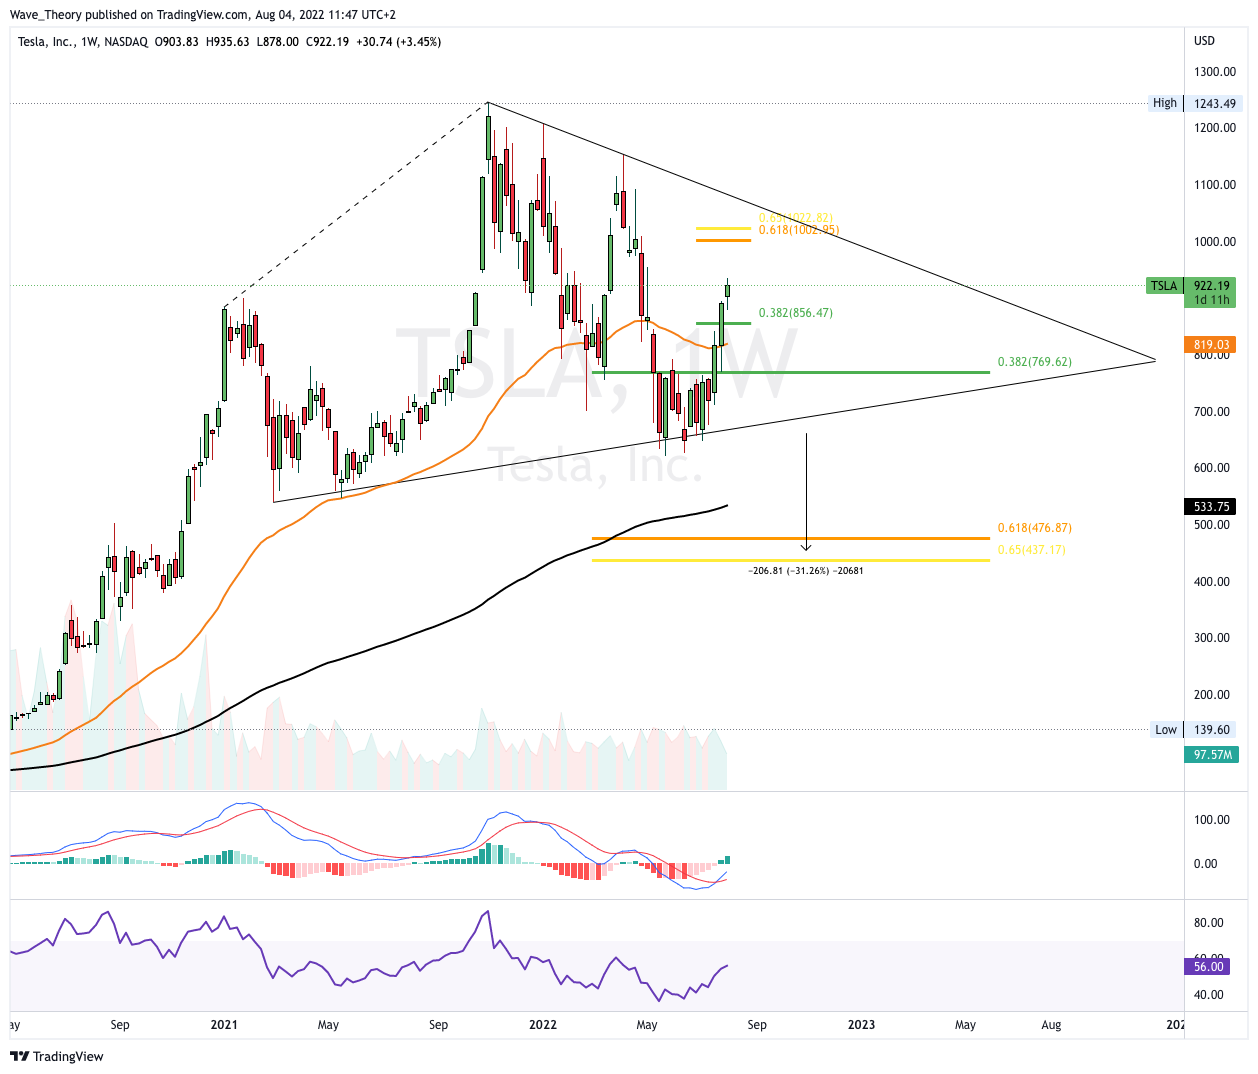
Also in the weekly chart, the MACD lines are crossed bullish and the histogram ticks bullish higher. If TESLA is rejected at the Golden Ratio, it would be very bullish if TSLA can stay above the 50-week EMA at around $ 819.
However, if the trend line breaks at around $ 655, the TSLA price could actually break out bearishly to target a lower low at around $ 460.
Here you can find the latest TSLA course forecast
Disclaimer
All information contained on our website is researched to the best of our knowledge and belief. The journalistic articles are for general information purposes only. Any action taken by the reader on the basis of the information found on our website is done exclusively at his own risk.