

The Cardano price is forming a series of higher lows and could now rise around 33% in a bullish breakout.
The Cardano price has been on an uptrend for four weeks
The Cardano price reached the low point at around $ 0.4 twice and since then Cardano has been in an upward movement for four weeks. Cardano is currently encountering significant resistance at around $ 0.54 at the 200-week EMA and should Cardano overcome this resistance, the next significant Fib resistance is around $ 0.58.
In addition, the MACD is clearly bullish on the weekly chart, because the histogram has been ticking bullish higher for several weeks and the MACD lines are crossed bullish. The RSI gives neither bullish nor bearish signals.
Cardano price reached correction target and bounced back strongly
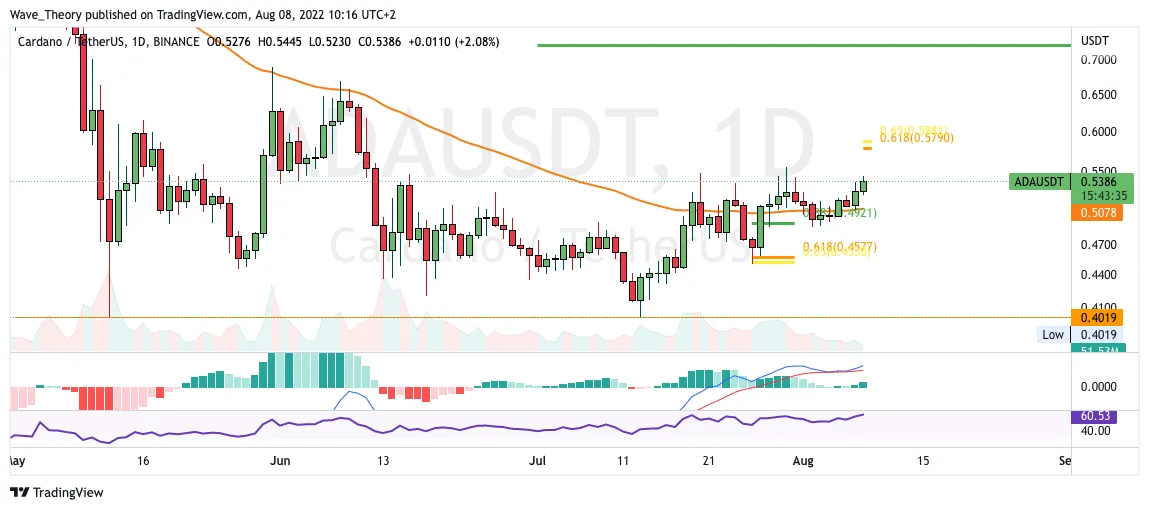
In the last Cardano price forecast we wrote: “The Cardano price has fallen very sharply in the last few days after a bearish divergence in the RSI had become apparent. Thus, the ADA price is now at Golden Ratio support at around $ 0.45, which ADA could bounce off.”
As a result, the ADA price rose about 12% in just one day and a total of about 23% since Cardano had reached the golden Ratio at around $ 0.45. Thus, the ADA price was also able to break the 50-day EM, which now serves as support at around $ 0.51.
Furthermore, the MACD is clearly bullish on the daily chart, because the histogram ticks bullish higher and the MACD lines are crossed bullish. In addition, the RSI is also neutral here.
Golden crossover in the 4H chart confirms the trend bullish in the short term
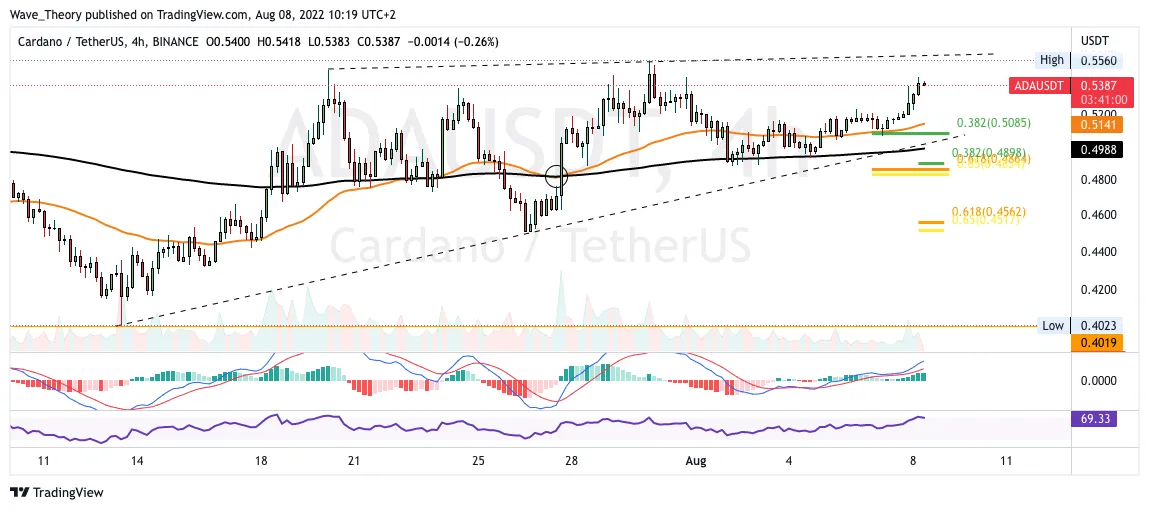
The Golden Crossover in the 4H chart confirms the trend bullish in the short term and most recently the ADA price was able to find support at the 50-4H EMA at the 0.382 Fib level at around $ 0.51. The Cardano course forms a series of higher lows and highs. Before Cardano can rise to around $ 0.58, horizontal resistance still awaits him at around $ 0.55.
In addition, the MACD is also clearly bullish in the 4H chart, because the histogram ticks bullish higher and the MACD lines are crossed bullish. If Cardano is nevertheless rejected at the resistance at around $ 0.55, significant Fibonacci support is waiting at around $ 0.51 and $ 0.48.
Histogram ticks bullish higher in the monthly chart
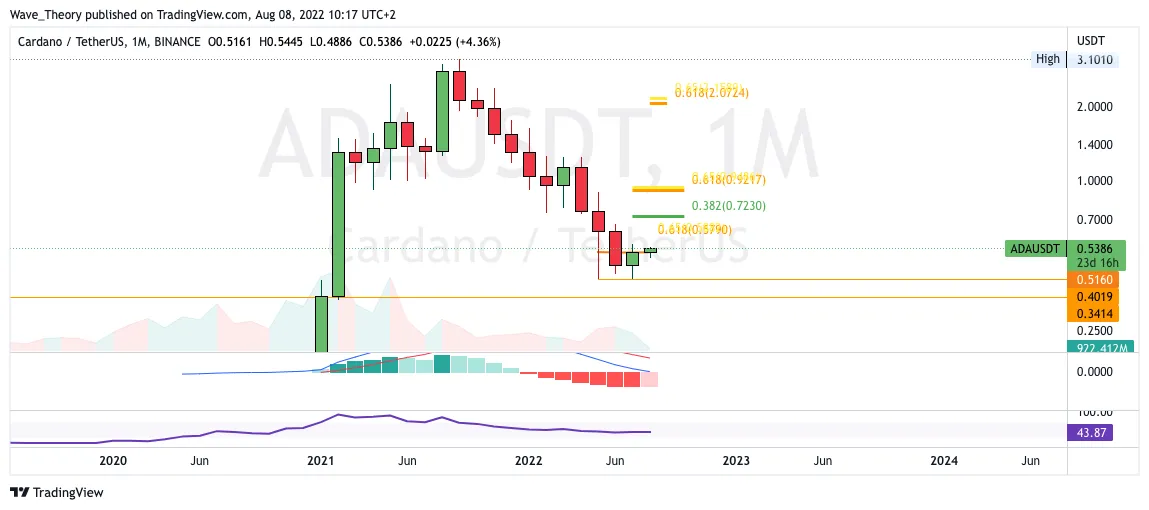
In the monthly chart, the histogram begins to tick bullish higher, which could initiate a bullish trend reversal. If Cardano breaks the Fib resistance at around $0.58, Cardano could rise around 33% to reach the next Fib level at around $0.72. If Cardano also breaks this resistance, the next significant Fibonacci resistance is waiting at around $ 0.93.
However, for a complete bullish trend reversal, Cardano will have to overcome the golden ratio at around $ 2.1, because without a break in the golden ratio at around $ 2.1, there are no chances of new highs.
Against BTC, the Cardano price is moving sideways
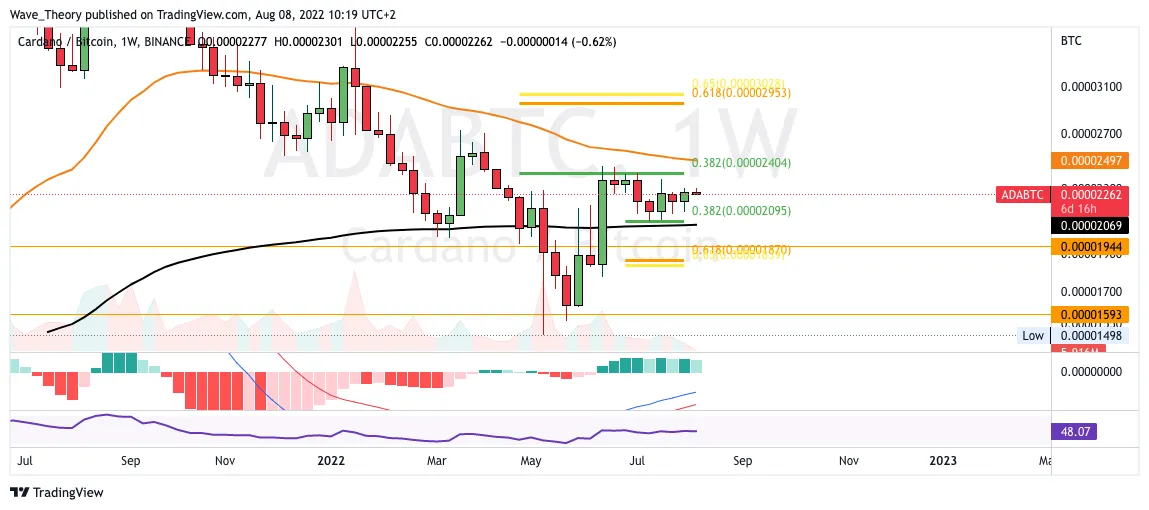
Against BTC, the ADA price is moving sideways and ranges between the 0.382 Fib resistance at around 0.00024 BTC and the 0.382 Fib support at around 0.00021 BTC. In addition, the 50-week EMA at around 0.00025 BTC acts as additional resistance, whereas the 200-week EMA at around 0.000207 BTC serves as additional support.
The MACD is also bullish against BTC, because the MACD lines are crossed bullish. In addition, the histogram was able to close bullish higher last week. This week it is starting to tick bearishly lower, but the week has only just begun and this could change over the course of the week.
Disclaimer
All information contained on our website is researched to the best of our knowledge and belief. The journalistic articles are for general information purposes only. Any action taken by the reader on the basis of the information found on our website is done exclusively at his own risk.