


The Dogecoin price could now rise around 24% if DOGE breaks this resistance. Has the DOGE course already reached the bottom?
Dogecoin Price Bounces Off Golden Ratio Support Several Times
For weeks, the DOGE price has been moving between 50-day EMA resistance at around $0.07 and the Golden Ratio support at around $0.06. On the 50-day EMA, the Dogecoin price was rejected several times and it has been able to bounce off the Golden Ratio support twice so far. Now the Dogecoin price is again at the 50-day EMA and if Dogecoin breaks the price range between 0.07 and 0.079 USD bullish, the next significant Fibonacci resistance is waiting for DOGE at around 0.098 USD.
In addition, the MACD’s histogram is ticking bullish higher and the MACD lines are crossed bullish. The RSI is neutral and gives neither bullish nor bearish signals.
The DOGE price could now rise by around 24%
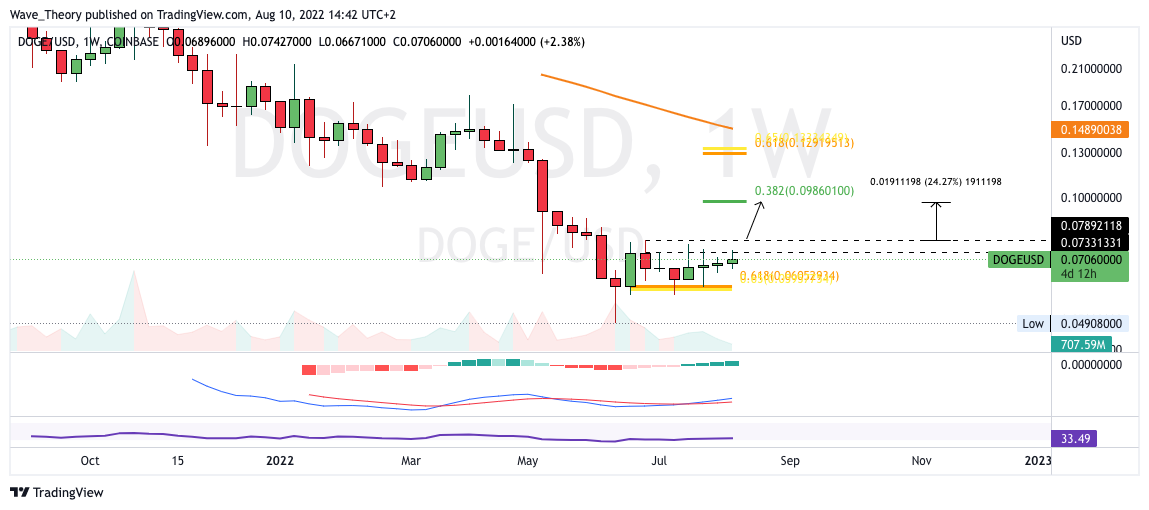
With a break in the horizontal resistance between $ 0.073 and $ 0.079, the DOGE price could still rise by about 24, until it encounters the 0.382 Fib resistance at around $0.098. If DOGE also breaks this resistance, the 200-day EMA is still waiting at around USD 0.1 before DOGE could rise to the golden ratio at around USD 0.13.
In addition, the MACD is clearly bullish on the weekly chart, because the histogram has been ticking bullish higher for several weeks and the MACD lines are also crossed bullish. In fact, the Dogecoin price may have already found its bottom at around 0.05 USD, because in the short to medium term it looks bullish for the Dogecoin price.
At around 0.087 USD, resistance is still waiting for the DOGE price
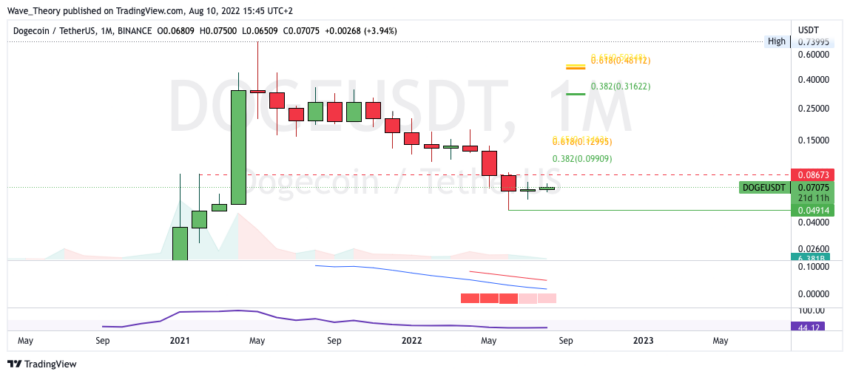
However, before the DOGE price reaches the Fib resistance at around $ 0.098, horizontal resistance is still waiting for it at around $ 0.087.
Otherwise, the histogram in the monthly chart has been ticking bullish higher since last month, which indicates a bullish trend reversal. However, the MACD lines are still bearishly crossed and the RSI is neutral.
For a fully bullish trend reversal, the DOGE price must break the Golden Ratio bullish at around $0.5. Only then is a new all-time high possible.
Against BTC, the DOGE price bounced on the 50-month EMA
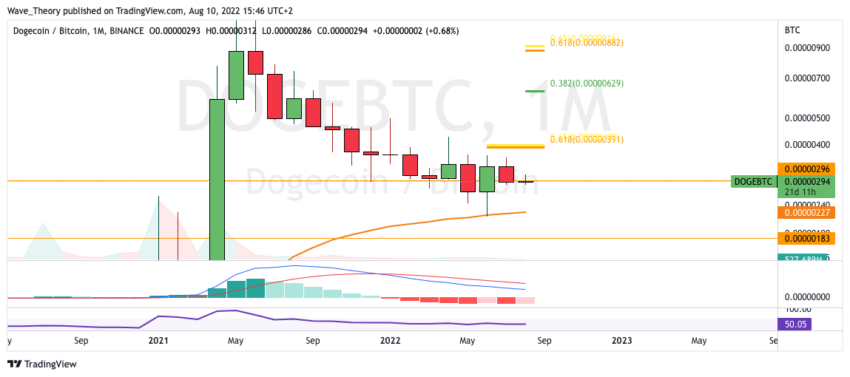
Gegen BTC, the DOGE price was able to bounce off the 50-month EMA at around 0.00000227 BTC the month before last. In addition, the histogram has been ticking bullish higher so far this month. However, the MACD lines still remain bearishly crossed.
The next significant Fibonacci resistance is encountered by the DOGE price at the Golden Ratio at around 0.000004 BTC. For this, however, the DOGE price must first overcome the 50-day EMA at around 0.000003 BTC.
Disclaimer
All information contained on our website is researched to the best of our knowledge and belief. The journalistic articles are for general information purposes only. Any action taken by the reader on the basis of the information found on our website is done exclusively at his own risk.