
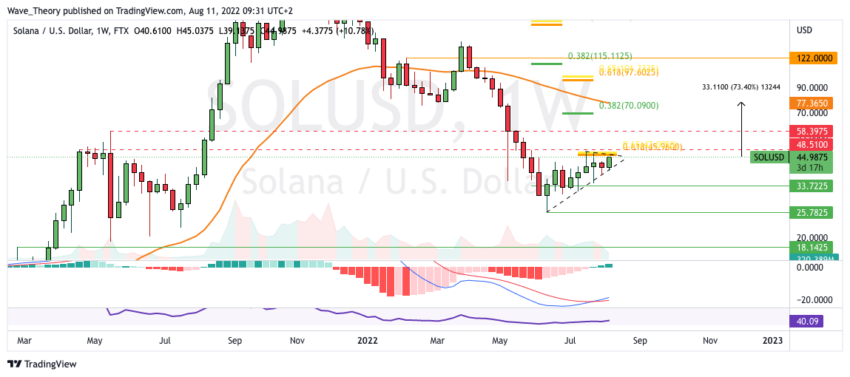
The Solana price could now break out bullish and rise around 50% in the course of it to reach the $ 70 mark.
Solana price could now break out bullish and rise around 50%
The Solana price forms a series of higher lows and is again above the 50-day EMA and just below the Golden Ratio resistance at around $ 46, at which the SOL price was rejected twice before. If Solana breaks the Golden Ratio resistance this time, Solana could rise around 50% to climb to the 200-day EMA or even to the 0.382 Fib level at the $70 mark.
In addition, the MACD is clearly bullish on the daily chart, because the histogram ticks bullish higher and the MACD lines are crossed bullish. The RSI is neutral and gives neither bullish nor bearish signals.
In the weekly chart, the MACD is clearly bullish
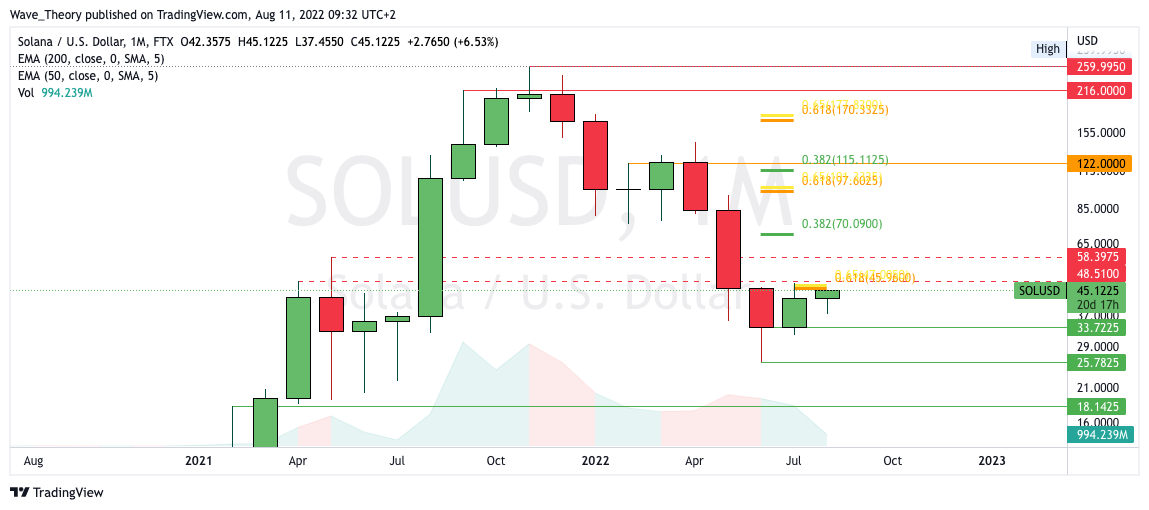
The MACD is also bullish on the weekly chart, because the histogram has been ticking bullish higher for weeks and the MACD lines crossed bullish a few days ago. Should Solana overcome the 0.382 Fib level at around USD 70, Solana will find the next significant resistance at the 50-week EMA at around USD77. This implies an upside potential of around 73%.
In addition, the RSI is also neutral on the weekly chart.
Horizontal resistance is still waiting for the Solana course
In the monthly chart, it can be seen that there is still horizontal resistance waiting for the SOL price between $ 48.5 and $ 58.4. However, a break in the golden ratio at around USD 46 suggests an increase to around USD 70.
For a bullish trend reversal with chances of new highs, Solana must first overcome the Golden Ratio at around $ 180. Until then, there are still some resistances waiting for the SOL course.
However, if SOL is rejected bearishly again at the Golden Ratio at around 46 USD, significant Fib supports are waiting for the SOL price at around 39 USD and 34 USD.
Against BTC, the SOL price is moving between 0.382 Fib levels
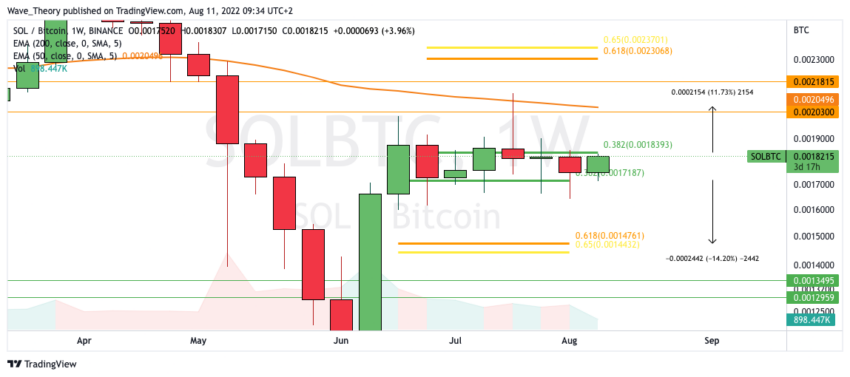
Against BTC, SOL has been between the 0.382 Fib resistance at around 0.00184 BTC and the 0.382 Fib support at around 0.00172 BTC for over seven weeks. If the 0.382 Fib support breaks, important Golden Ratio support is waiting around 14% lower at around 0.00145 BTC.
If the SOL price breaks the 0.382 Fib resistance, SOL could rise to the 50-week EMA at around 0.00205 BTC, where SOL was already bearishly rejected a few weeks ago. This implies an upside potential of around 12%.
Disclaimer
All information contained on our website is researched to the best of our knowledge and belief. The journalistic articles are for general information purposes only. Any action taken by the reader on the basis of the information found on our website is done exclusively at his own risk.