


The Polkadot price is basically bullish, but could now encounter bearish rejection at the Golden Ratio resistance in the short term and initiate a correction.
Polkadot price breaks the 50-day EMA bullish
The Polkadot price was able to break the 50-day EMA resistance at around $ 8.1 bullish at the end of last month. This now serves as a support and Polkadot could already bounce off it. Currently, the Polkadot price is very close to the Golden Ratio resistance at around 9.7 USD.
The MACD lines are still crossed bullish and the RSI does not give bearish signals. The MACD’s histogram, on the other hand, is already ticking bearishly lower.
The DOT price is clearly bullish on the weekly chart
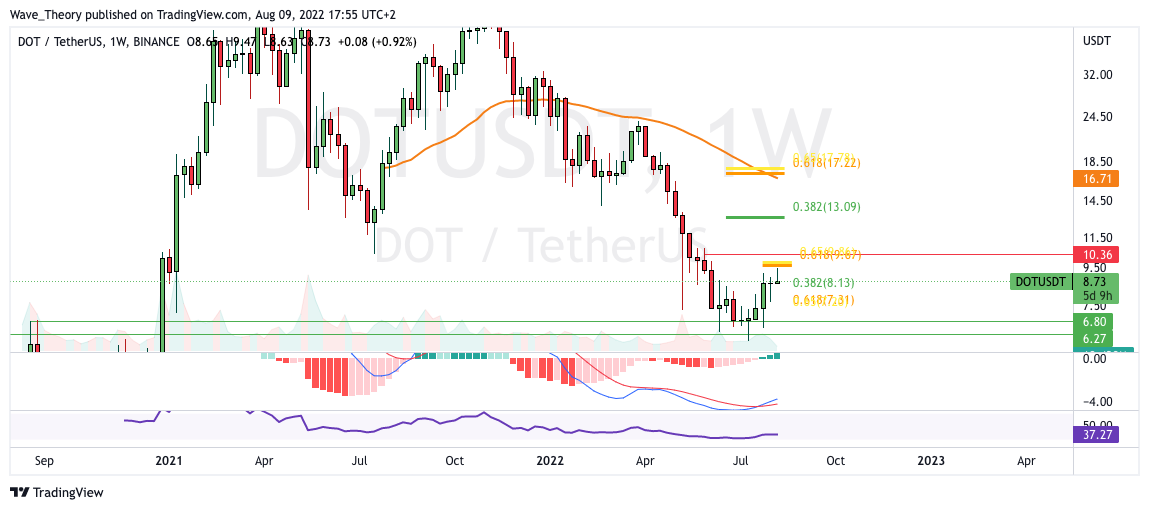
In the weekly chart, the DOT price is clearly bullish, because the histogram of the MACD has been ticking bullish higher for several weeks and the MACD lines are also crossed bullish. The RSI is neutral.
Nevertheless, the DOT price is currently encountering significant resistance at the Golden Ratio at around 9.7 USD, where the DOT price could be rejected. Then the DOT price could correct to the Fibonacci supports at around $ 8.1 and $ 7.3.
If the DOT price breaks the Golden Ratio bullish at around $ 9.7, the next significant Fibonacci resistances are waiting at around $ 13.1 and $ 17.2. In addition, the 50-week EMA acts as additional resistance at around $ 16.7.
Polkadot price could not close bullish last month
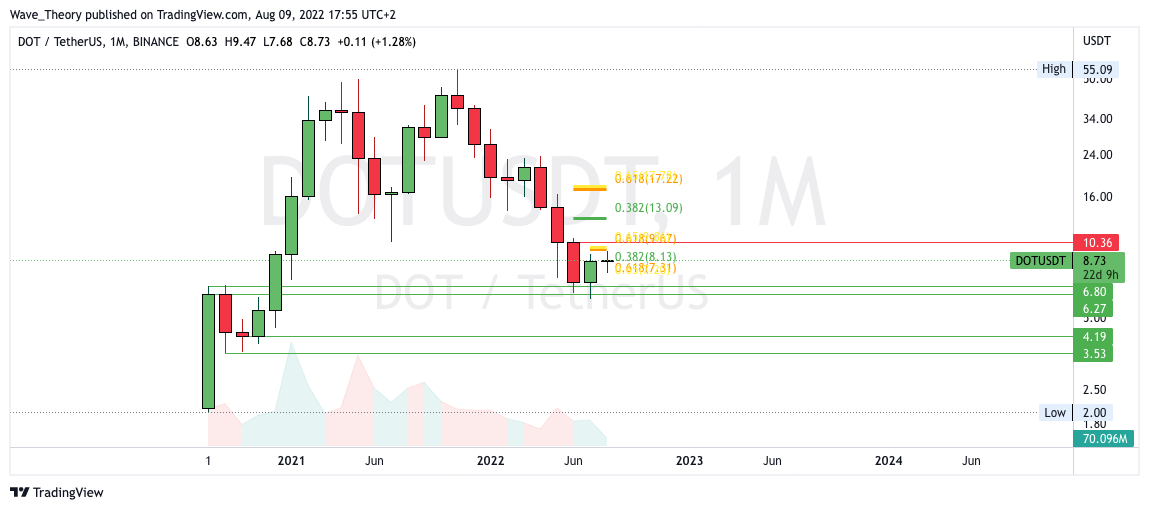
The month of July was quite bullish for the DOT price, because Polkadot rose over 53% last month. Nevertheless, it was not enough for a bullish candlestick formation in the monthly chart. Nevertheless, the DOT price continued the upward movement in the new month and approached the Golden Ratio resistance at around $ 9.7. A month-end price above the golden ratio would definitely be bullish for the coming month of September.
Against BTC, the Polkadot price could bounce strongly at the Golden Ratio
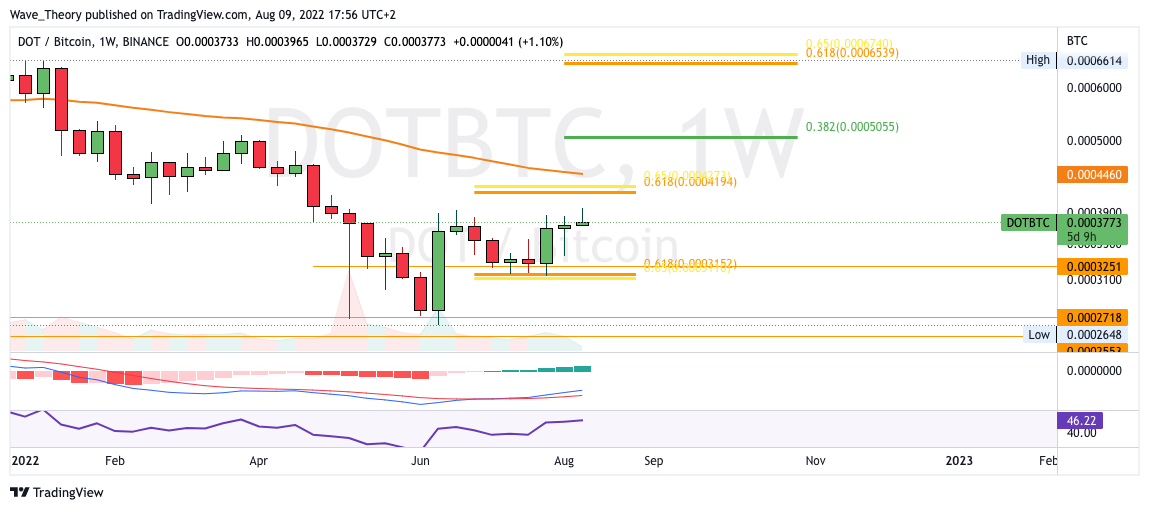
Against BTC, the Polkadot price was able to bounce strongly against the Golden Ratio support at around 0.000315 BTC and thus moves towards the Golden Ratio resistance at around 0.00042 BTC. In addition, the 50-week EMA is running at around 0.000445 BTC, which also acts as resistance. If the DOT price breaks both resistances, the next significant Fib resistance is waiting at around 0.005 BTC.
In addition, the MACD is clearly bullish on the weekly chart, because the histogram ticks bullish higher and the MACD lines are crossed bullish. The RSI gives neither bullish nor bearish signals.
Disclaimer
All information contained on our website is researched to the best of our knowledge and belief. The journalistic articles are for general information purposes only. Any action taken by the reader on the basis of the information found on our website is done exclusively at his own risk.