


The Bitcoin price fell the last few days as expected, but did not reach the correction target of around 22,000 USD.
Will the Bitcoin price overcome the 50-day EMA resistance?
True, the Bitcoin price fell as expected after our last analysis, but not to the 0.382 Fib support at around $ 22,000. Instead, Bitcoin bounced at around $22,400 at the penultimate high yesterday and has risen almost 5% since then. Thus, Bitcoin is now at the 50-day EMA, which acts as an important resistance.
If Bitcoin breaks the 50-day EMA, it looks like the correction has come to an end. Then Bitcoin could surpass its last high point and target the Golden Ratio at around $26,800. In addition, Bitcoin thus again formed a higher low, which marks the fourth in a row. Bitcoin previously formed three higher highs in a row and with the break of the 50-day EMA, another higher high point is close.
The MACD lines lie on top of each other and could cross over both bearish and bullish. However, the histogram ticked bearishly lower and could tick bullish higher today. The RSI is neutral.
Bitcoin Price Is Now at Golden Ratio Resistance
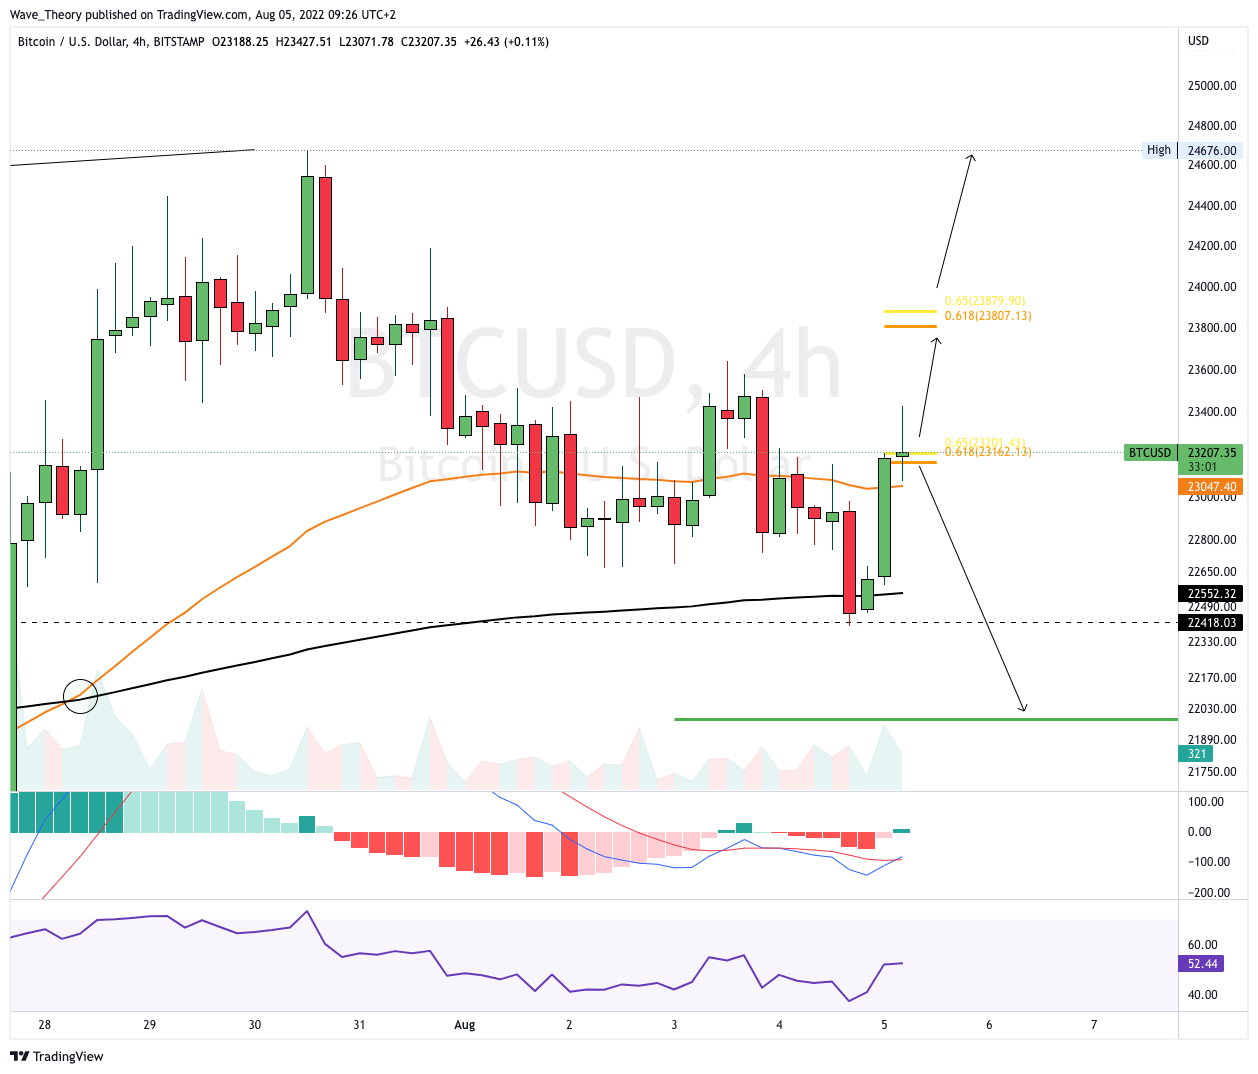
Bitcoin is currently at a golden ratio resistance at around 23,200 USD. If Bitcoin is rejected, Bitcoin may continue the downward trend and our correction target of around $ 22,000 would be in prospect.
On the other hand, if Bitcoin breaks the golden ratio bullish, the next golden ratio resistance is waiting at around $ 23,850. If this is also broken, the next significant resistance is waiting at around $ 24,700 before Bitcoin could rise to around $ 26,800.
In addition, the Golden crossover of the EMAs confirms the trend bullish in the short term and the MACD is also bullish in the 4H chart. Because the MACD lines have now crossed bullish and the histogram is ticking bullish higher. The RSI is neutral.
The weekly chart is still bullish
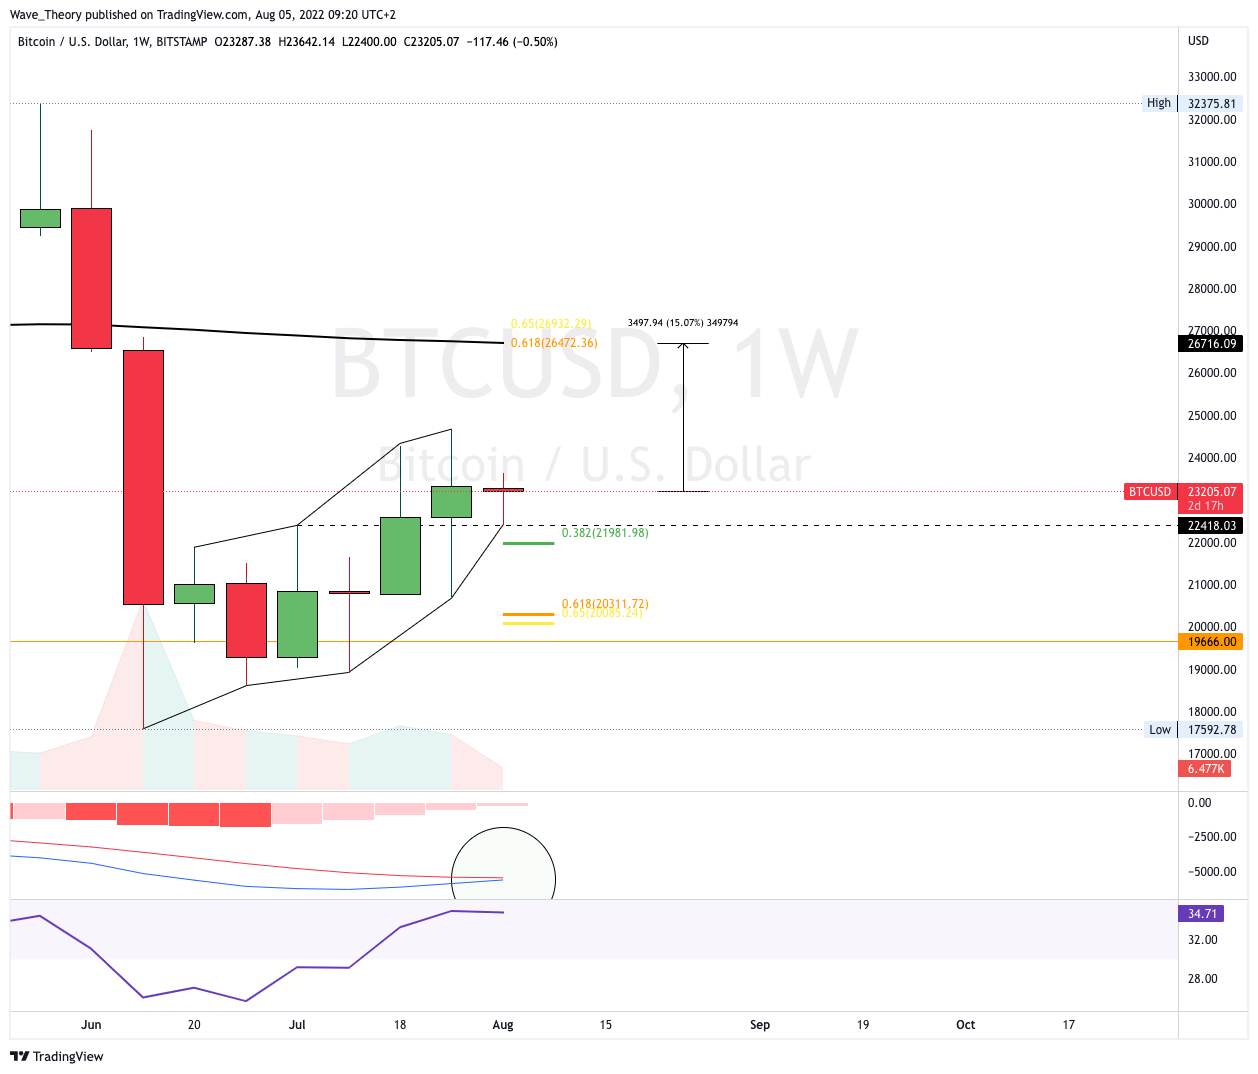
The histogram on the weekly chart continues to tick bullish higher and the MACD lines are on the verge of a bullish crossover. In addition, the RSI is also neutral here. Should Bitcoin rise to the Golden Ratio at around $ 26,800, which additionally runs the 200-week EMA, this implies an upside potential of around 15%.
With a break in the golden ratio at around $ 26,800, it looks very bullish for the BTC price. The next significant Fibonacci resistance is then around $ 29,300.
Will the bullish trend reversal for the Bitcoin price take place in August?
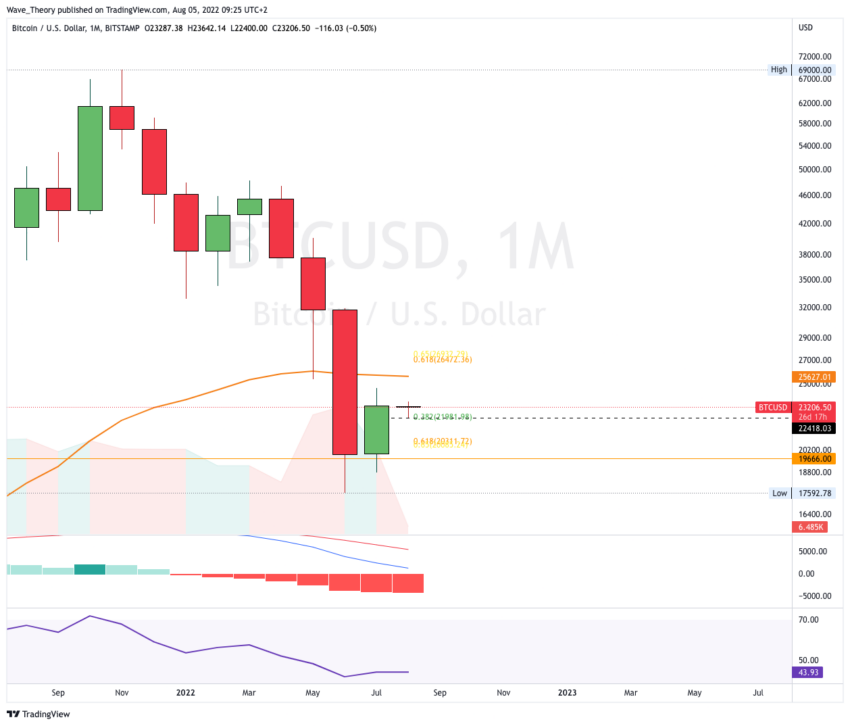
The Bitcoin price is already finding significant resistance at around $ 25,600 at the 50-month EMA, before the BTC price reaches the golden Ratio at around $ 26,800. For the beginning of a bullish trend reversal, the histogram of the MACD should close bullish higher this month than in July.
So far, there is no bullish confirmation of a bullish trend reversal in August.
Here is the last Bitcoin price forecast.
Disclaimer
All information contained on our website is researched to the best of our knowledge and belief. The journalistic articles are for general information purposes only. Any action taken by the reader on the basis of the information found on our website is done exclusively at his own risk.