


The Ethereum price reached just under 1,819 USD and thus missed the price target at around 1,912 USD by around 5%. Will Ethereum still achieve it?
Ethereum price reaches a high point at around 1.819 USD
For the past five weeks, the ETH price has been rising continuously, reaching a peak at around 1,819 USD this week. However, the new week starts rather bearish and Ethereum seems to be initiating a correction. The decisive factor for a bullish course and a speedy achievement of the price target at around $ 1,912 is whether Ethereum can hold above the 200-week EMA at around $ 1,600. With the establishment of the high point at around 1,819 USD, Ethereum has so far missed the price target at around 1,912 USD by around 5%.
In addition, the MACD is clearly bullish on the weekly chart, because the histogram ticks bullish higher and the MACD lines are crossed bullish. The RSI is neutral.
Ethereum Price Forms a series of Higher Lows
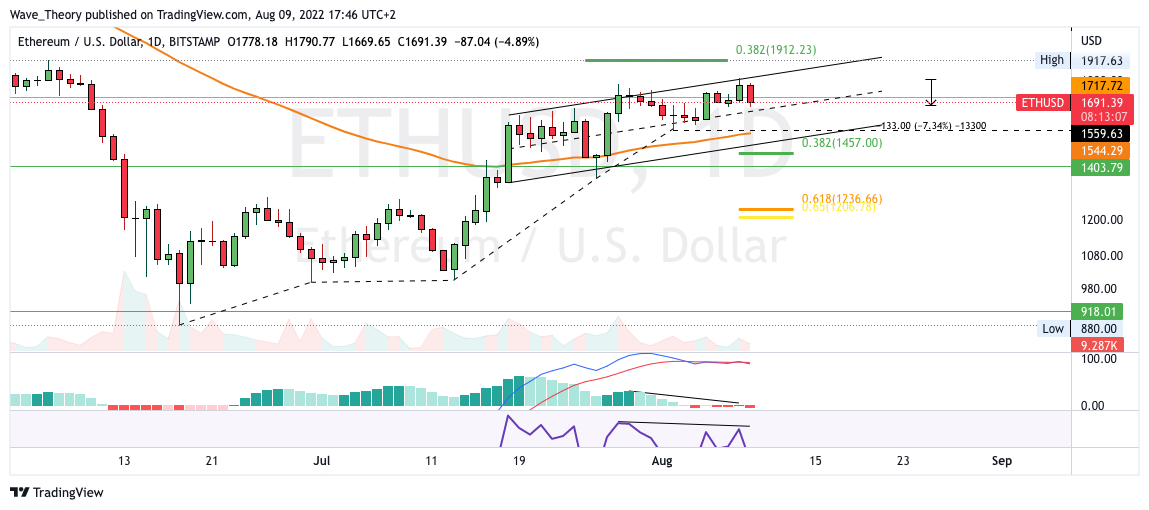
The Ethereum price has already established four higher lows in a row, while it has now formed a higher high point for the third time in a row. This also means that Ethereum is in a parallel upward channel and if Ethereum maintains the series at higher lows, Ethereum may not fall below around $ 1,560.
On the other hand, there is significant support just below the 50-day EMA at around $ 1,544 and if this is broken bearishly, significant Fibonacci support is waiting for Ethereum at around $ 1,457 and at around $ 1,235.
The Ethereum price has already fallen around 7.5% since yesterday and currently the RSI and the histogram of the MACD show a bearish divergence. A correction between the 0.382 Fib level at around $ 1,457 and the last low at around $ 1,560 is in prospect.
In the 4H chart, the ETH price is at trendline support
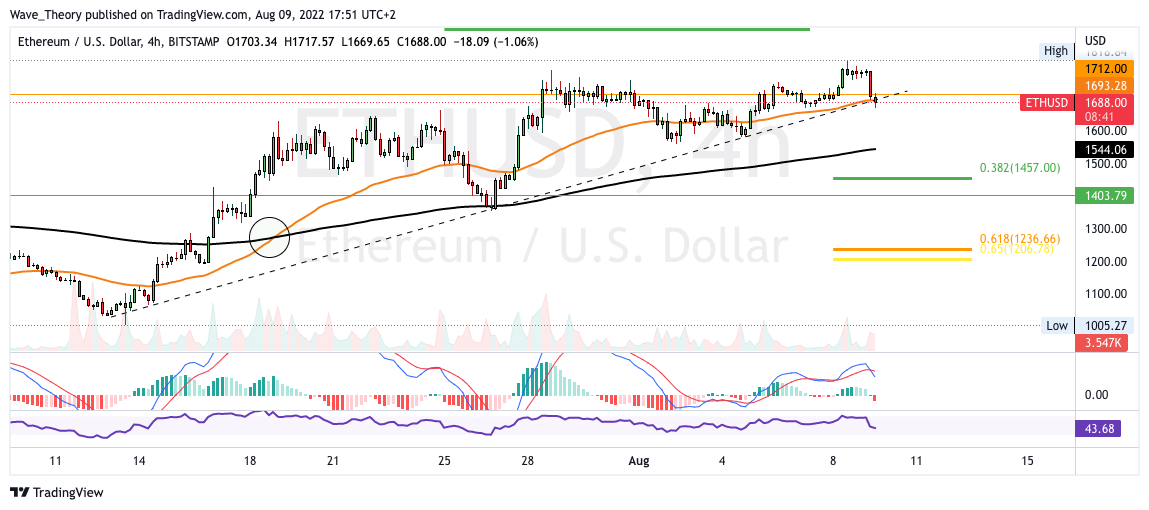
Currently, the ETH price at the 50-4H-EMA is encountering trend line support at around USD 1,693. A break of this trend line strengthens the bearish prospect of a continuation of the corrective movement. However, as soon as Ethereum bounces off one of the supports, it can make another attempt to reach the 0.382 Fib level at around $ 1,912. In addition, the Golden Crossover in the 4H chart still confirms the trend bullish in the short term.
Ethereum Price Should Stay Above 50-Month EMA This Month
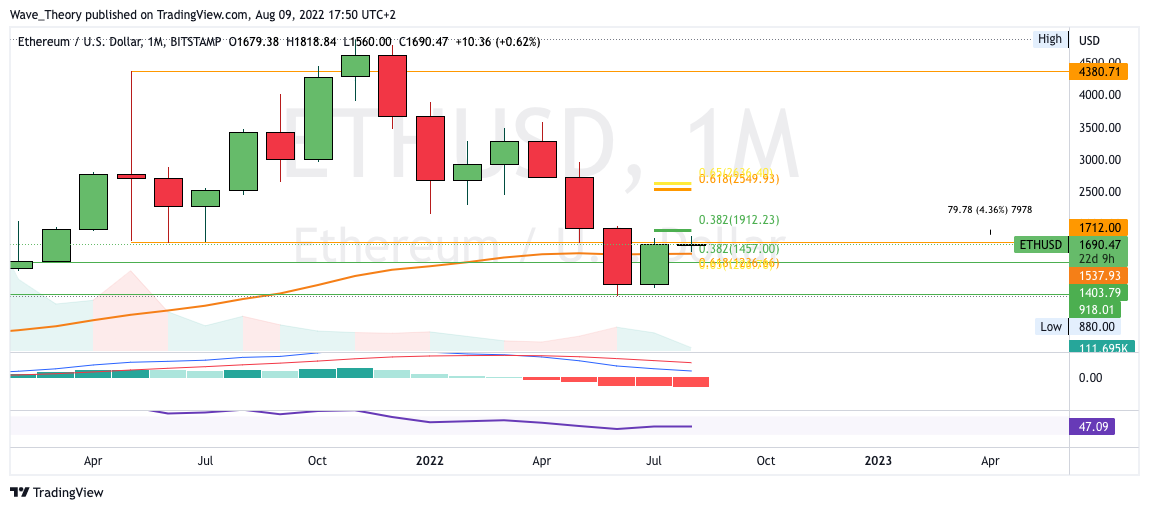
The Ethereum price should stay above the 50-month EMA at around $1,538 this month to remain bullish. Otherwise, the MACD is still clearly bearish on the monthly chart, because the histogram is ticking bearishly lower and the MACD lines are crossed bearishly. The RSI is neutral and gives neither bullish nor bearish signals.
Against BTC, the ETH price could correct now
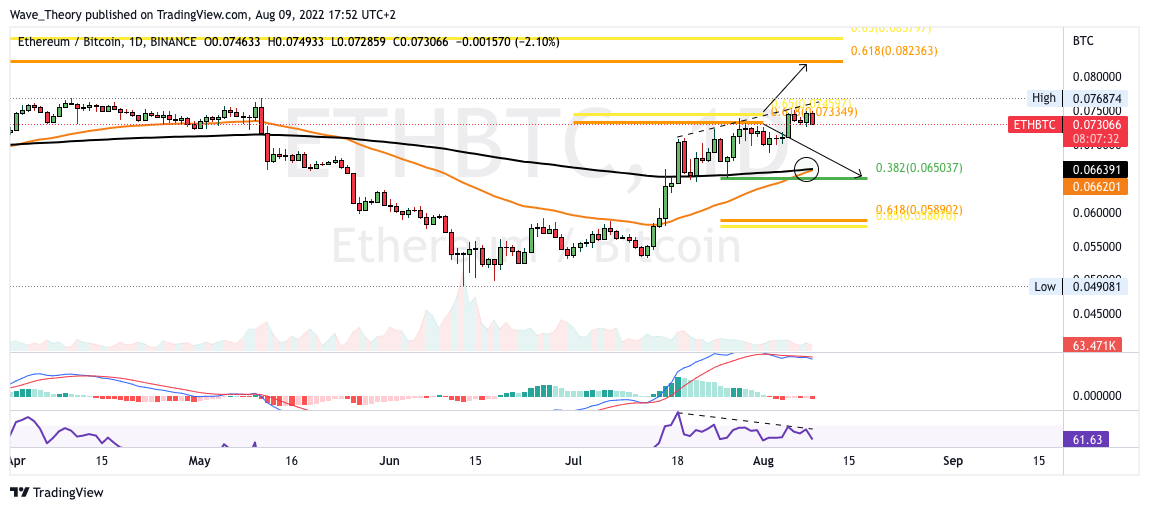
Against BTC, the Ethereum price again encountered significant resistance at the golden Ratio at around 0.074 BTC, where Ethereum could now be rejected. In addition, the RSI shows a bearish divergence in the daily chart, whereupon the ETH price could now correct to the 0.382 Fib support at around 0.065 BTC. In addition, the MACD lines are also crossed bearishly and the histogram is ticking bearishly lower.
In contrast, the EMAs are on the verge of a golden crossover, which would confirm the trend bullish in the short to medium term.
Disclaimer
All information contained on our website is researched to the best of our knowledge and belief. The journalistic articles are for general information purposes only. Any action taken by the reader on the basis of the information found on our website is done exclusively at his own risk.