


The XRP price bounced bullish again and could now make an attempt to break the Golden Ratio bullish at around $ 0.4.
XRP Price bounces Again and targets Golden Ratio Resistance
In the last XRP price forecast, we wrote: “Thus, the XRP price is now at the 50-day EMA, which is just above the 0.382 Fib Support at around $0.3665 located. If the XRP price bounces off it, it could possibly make a second attempt to break the Golden Ratio resistance at around $ 0.4.”
In fact, the XRP price has now again formed a higher low point and thus maintains the series of higher low points, because this is now the third higher low point in a row. Previously, the Ripple price formed a higher high point, but was rejected bearishly at the Golden Ratio resistance at around $ 0.4.
The XRP price could now target this resistance again. However, the MACD is currently giving mixed signals, the MACD lines are on top of each other and the histogram has been ticking bullish higher and bearish lower in recent days. The RSI is neutral and gives neither bullish nor bearish signals.
Golden crossover in the 4H chart confirms the trend bullish in the short term
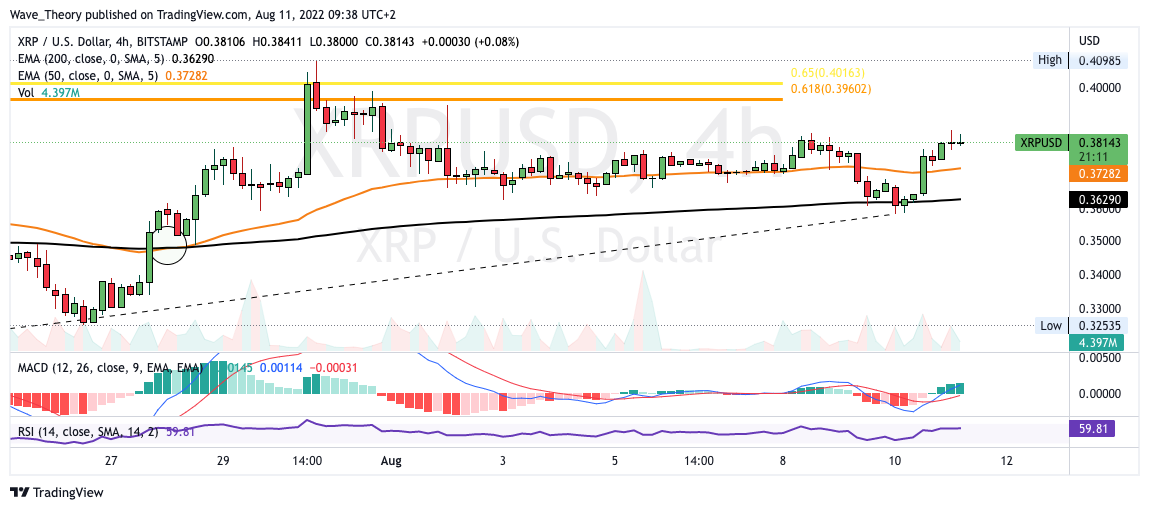
A golden crossover was established in the 4H chart a few days ago, which confirms the trend bullish in the short term. In addition, the XRP price was able to bounce off the 200-4H EMA and break the 50-4H EMA resistance.
In the 4H chart, the MACD is clearly bullish, because the histogram ticks bullish higher and the MACD lines are crossed bullish. The RSI is also neutral here.
Is the XRP price now rising around 33%?
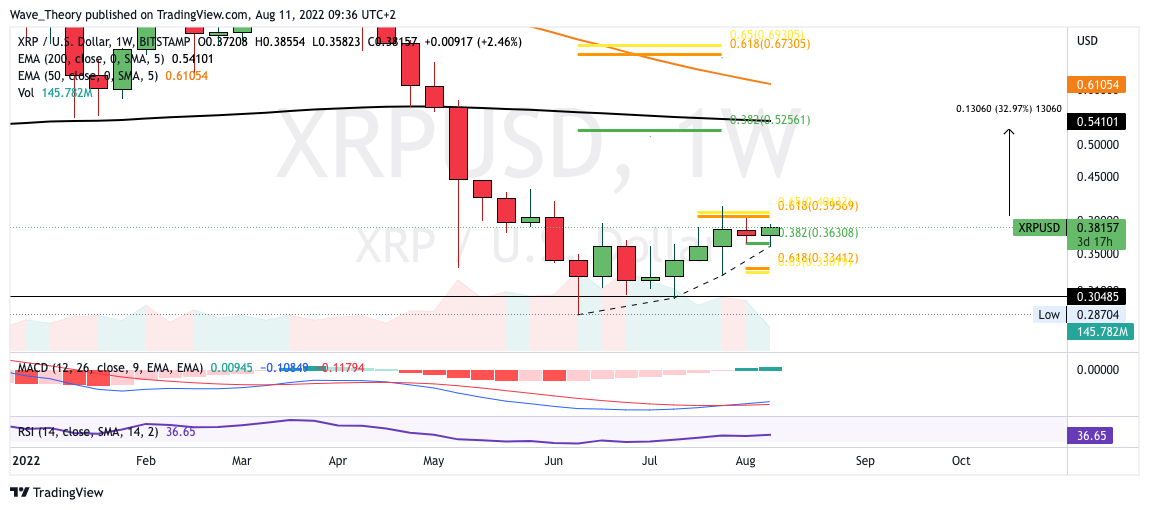
If the Ripple price breaks the Golden Ratio resistance at around $0.4, XRP could break out bullish and rise around 33% to reach the 200-week EMA at the 0.382 Fib level at around $0.54. The MACD is also bullish on the weekly chart, because the histogram has been ticking bullish higher for several weeks and the MACD lines are also crossed bullish.
So in the medium term, it still looks bullish.
Histogram in the monthly chart ticks bullish higher
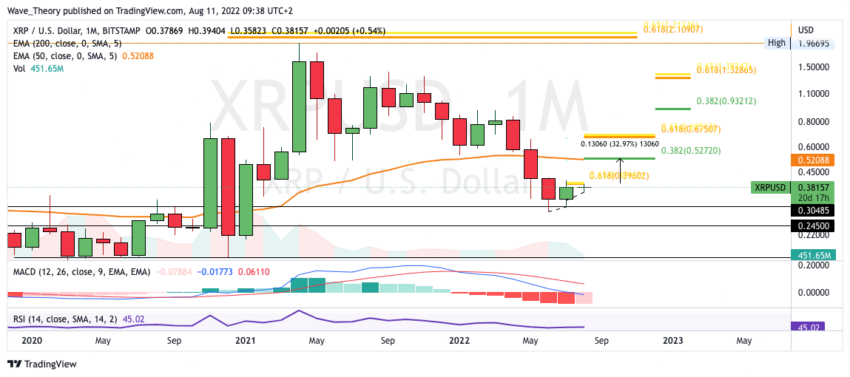
On the monthly chart, the MACD’s histogram is starting to tick bullish higher this month. If XRP breaks the Golden Ratio at around $0.4 and closes above it this month, the MACD’s histogram may also close bullish higher.
At around $ 0.52, the XRP price not only hits the 0.382 Fib level, but also the 50-month EMA, which also serves as a significant resistance. The price range between $ 0.52 and $ 0.54 thus marks the bullish price target, should XRP leave the $ 0.4 mark behind.
If, on the other hand, XRP is rejected bearishly again, significant Fibonacci supports are waiting for it at the latest at around 0.36 and 0.33 USD.
Ripple Price Could Correct against BTC Now
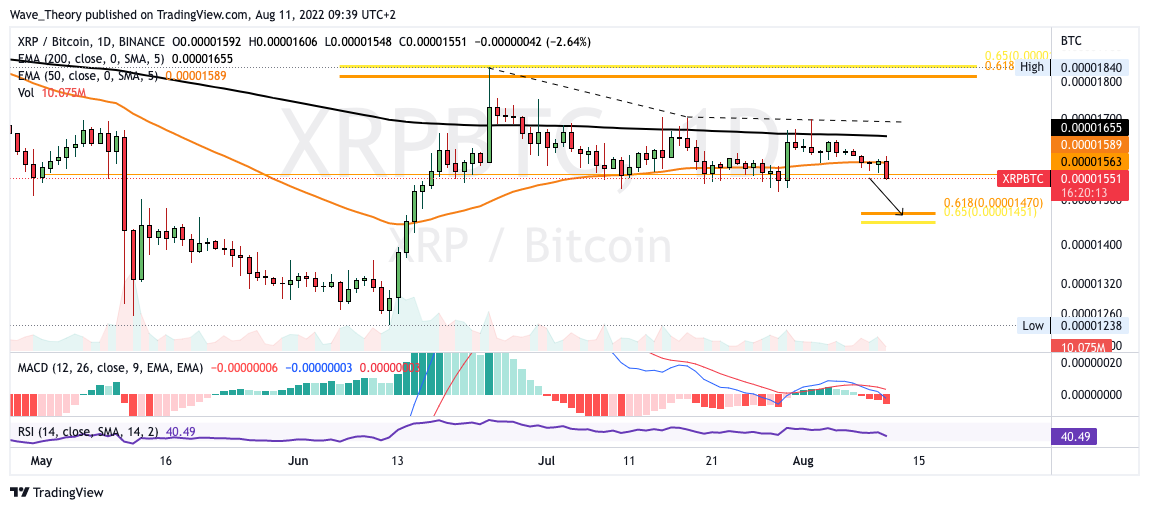
Against BTC, the XRP price has now been rejected for the second time at the 200-day EMA resistance at around 0.00001655 BTC, after Ripple was previously rejected at the Golden Ratio resistance at around 0.0000184 BTC. With this, XRP has now also broken the 50-day EMA, which could allow Ripple to return to the Golden Ratio support at around 0.0000145 BTC.
The MACD is also clearly bearish, because the histogram has been ticking bearishly lower for days and the MACD lines are crossed bearishly.
For the last Ripple price forecast, click here.
Disclaimer
All information contained on our website is researched to the best of our knowledge and belief. The journalistic articles are for general information purposes only. Any action taken by the reader on the basis of the information found on our website is done exclusively at his own risk.