


Despite the bullish outlook in the medium term, the Bitcoin price has fallen in the short term. Is the BTC price breaking the resistance now?
The Bitcoin price could correct to around $ 22,000 if the trendline breaks
The Bitcoin price closed below the 50-day EMA yesterday after being bearishly rejected at the horizontal resistance of the previous highs between $ 24,246 and $ 24,664. Bitcoin is still above the trendline support of the higher lows, but should Bitcoin fall below $22,418, the series would be broken at higher lows. Thus, Bitcoin would have a downside potential of around 5% until it reaches the 0.382 Fib support at around $22,000.
Should Bitcoin break this Fibonacci support, the next significant fib support is waiting for BTC between $20,000 and $20,300. In addition, Bitcoin formed a lower high point with the bearish rejection at the resistance and the MACD lines have now crossed bearishly, while the histogram is ticking bearishly lower.
However, should Bitcoin struggle and close above the 50-day EMA again today, it looks like a continuation of the upward movement.
Correction target will be negated if Bitcoin overcomes $23,700
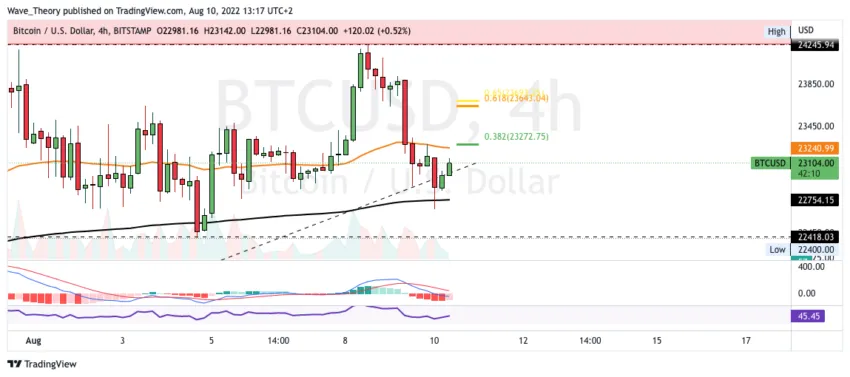
On the other hand, the bearish outlook on the daily chart, the 4H chart still gives bullish hope. Thus, the BTC price only corrected to the 200-4H EMA at around 22,750 USD, which Bitcoin has been able to bounce off so far. In addition, the histogram of the MACD is currently ticking bullish higher.
Bitcoin is now finding significant resistance at the 50-4H EMA at around 23,240 and if Bitcoin should overcome this, it could rise to the golden ratio at around 23,700 USD. If Bitcoin breaks the Golden Ratio bullish at around $23,700, the correction target would be invalid and Bitcoin could once again attempt to overcome the horizontal resistance between $24,246 and $24,664.
Will the Bitcoin price still reach the price target at around $ 26,800?
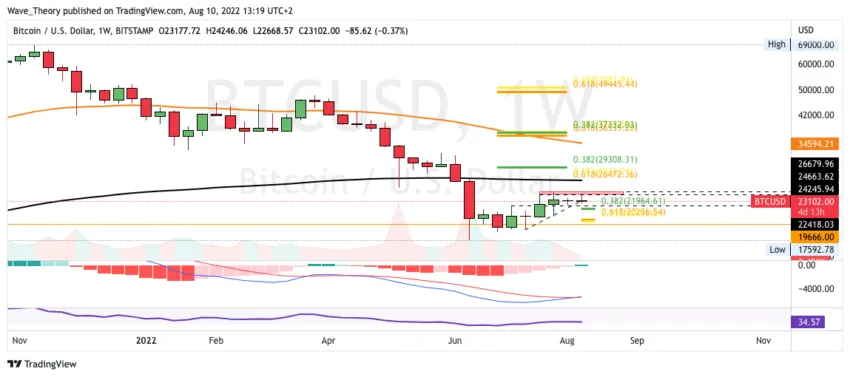
In the medium term, however, it still looks bullish, because the MACD lines are crossed bullish and the histogram continues to tick bullish higher. The RSI is neutral and gives neither bullish nor bearish signals.
Nevertheless, some resistance is now waiting for BTC, because at the golden ratio at around 26,800 USD, the 200-week EMA is also running, which also acts as resistance. The next big resistance is then between $35,000 and $37,000, because that’s where Bitcoin encounters the 50-week EMA and two important Fibonacci levels.
Ideally, Bitcoin closes above the 50-month EMA this month

In order for the MACD’s histogram to close bullish higher this month, Bitcoin should continue the upward movement of the last month. Ideally, Bitcoin should close above the 50-month EMA at around $25,625. So far, the MACD is still clearly bearish on the monthly chart, because the histogram is ticking bearishly lower and the MACD lines remain crossed bearishly.
The Bitcoin dominance continues to decline, but meets with support

The Bitcoin dominance has been declining for weeks, while the Ethereum dominance is rising sharply. Bitcoin is currently experiencing between 39 and 41.3% support. The 50-week EMA at around 44.3% acts as a significant resistance.
However, the MACD is clearly bearish on the weekly chart, because the histogram ticks bearishly lower and the MACD lines remain bearishly crossed.
The crypto market was again rejected at the Golden Ratio resistance
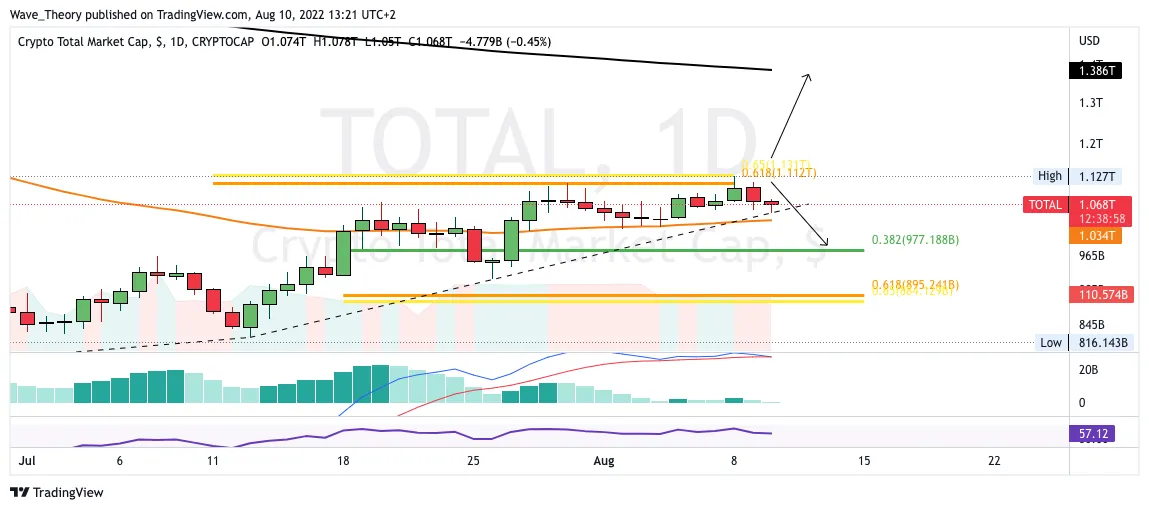
In the daily chart of the market capitalization of the crypto market, the MACD is bearish, because the histogram is ticking bearishly lower and the MACD lines are on the verge of a bearish crossover.
In addition, the crypto market has now been rejected again at the Golden Ratio at around USD 1.1 trillion, whereupon the crypto market seems to be returning to the 50-day EMA at around USD 1.034 trillion.
If the 50-day EMA support is broken bearishly, the market capitalization of the crypto market could fall to around $ 977 billion to bounce at the 0.382 Fib level. Otherwise, significant support is waiting for the crypto market at around $ 890 at the latest.
Disclaimer
All information contained on our website is researched to the best of our knowledge and belief. The journalistic articles are for general information purposes only. Any action taken by the reader on the basis of the information found on our website is done exclusively at his own risk.