


The Bitcoin price is extremely bullish and can now rise by around 11% until it reaches our price target. But this could be just the beginning.
Still around 11% until the Bitcoin price picks up the price target
The Bitcoin price still has about 11% room to move up until it has picked up the price target at around $ 26,800. In the last BTC price forecast, we wrote: “If Bitcoin breaks the 50-day EMA, it looks like the correction has come to an end. Then Bitcoin could surpass its last high point and target the Golden Ratio at around $26,800. In addition, Bitcoin thus again formed a higher low, which marks the fourth in a row. Bitcoin previously formed three higher highs in a row and with the break of the 50-day EMA, another higher high point is close.”
In addition, the histogram of the MACD is ticking bullish higher today and the MACD lines are also crossed bullish in the daily chart. The RSI is approaching overbought regions, but gives neither bullish nor bearish signals.
200-Week EMA Cuts Golden Ratio Resistance
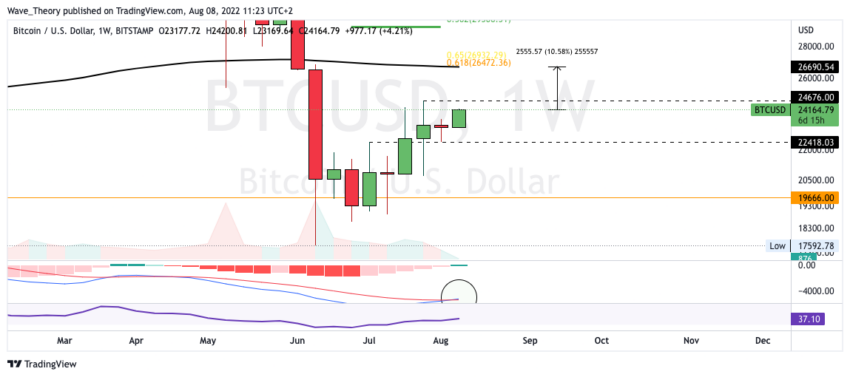
Due to the important Golden Ratio resistance at around $ 26,800, the 200-week EMA also runs, which also acts as a resistance. If BTC is rejected, significant Fibonacci supports are waiting at around $ 23,150 and $ 21,000.
However, for an increase to around $ 26,800, Bitcoin must first surpass the last high point at around $ 24,700. In the medium term, however, it still looks strongly bullish, because now the MACD lines also crossed bullish while the histogram is gradually ticking bullish higher.
The RSI is also neutral here.
The Bitcoin price could rise to around $ 37,000 in August

There are now some resistances waiting for the BTC price before it can rise to around $ 37,000. In addition, the 50-month EMA is already acting as a significant resistance at around $ 25,662.
If Bitcoin breaks the resistance and also overcomes the 0.382 Fib level at around $ 29,300, the bullish price target is around $ 37,000. This is where Bitcoin encounters a very important golden ratio. If Bitcoin breaks the golden ratio at around $37,000, BTC is just one step away from a complete bullish trend reversal. Because the final key resistance is at the $ 50,000 mark and if BTC breaks this price level, it can target new highs.
MACD’s histogram could close bullish
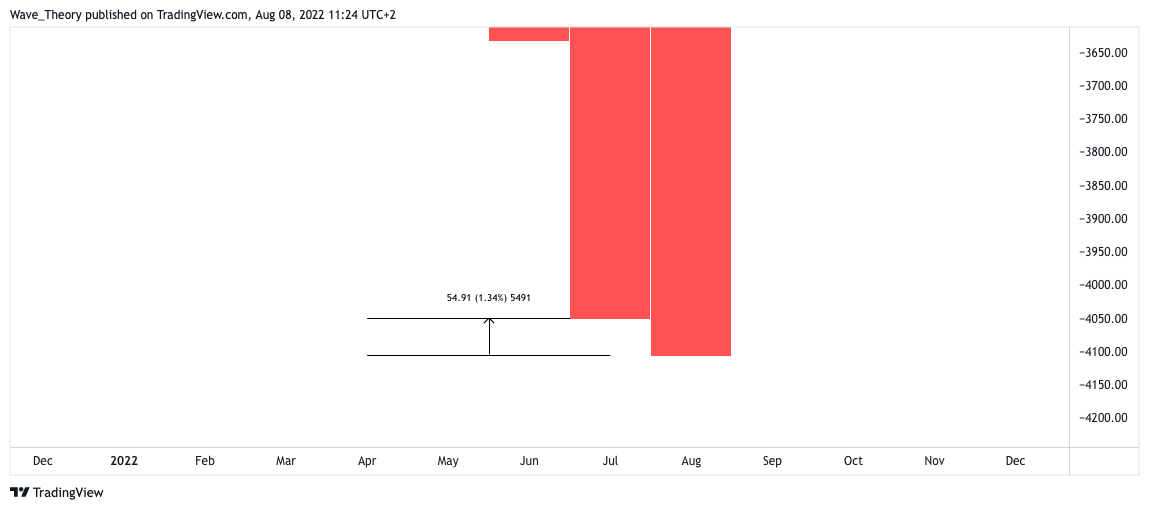
There are still about three weeks until the monthly candle closes. So far, it looks very good for the histogram in the monthly chart, because the histogram is currently only about 1.3% lower than in the previous month. Should it close bullish, this would be a strong indicator of a new bull cycle.
You can find out why the histogram is of great importance this month here.
Disclaimer
All information contained on our website is researched to the best of our knowledge and belief. The journalistic articles are for general information purposes only. Any action taken by the reader on the basis of the information found on our website is done exclusively at his own risk.