


The Bitcoin price is no longer far from its bullish price target at around 26,800 USD. Will the BTC rate be rejected on this?
Bitcoin price is at horizontal resistance
The Bitcoin price is still at the horizontal resistance between 24.250 and 24.675 USD and if BTC is rejected from it, Bitcoin could correct to the 50-day EMA at around 23.350 USD or even to the 0.382 Fib support at around 22.150 USD.
However, the MACD and RSI do not give any signs of a correction and at the moment, it looks more like Bitcoin could break the resistance to reach the golden Ratio at around $ 26,800.
In the short term, the Bitcoin price could correct now
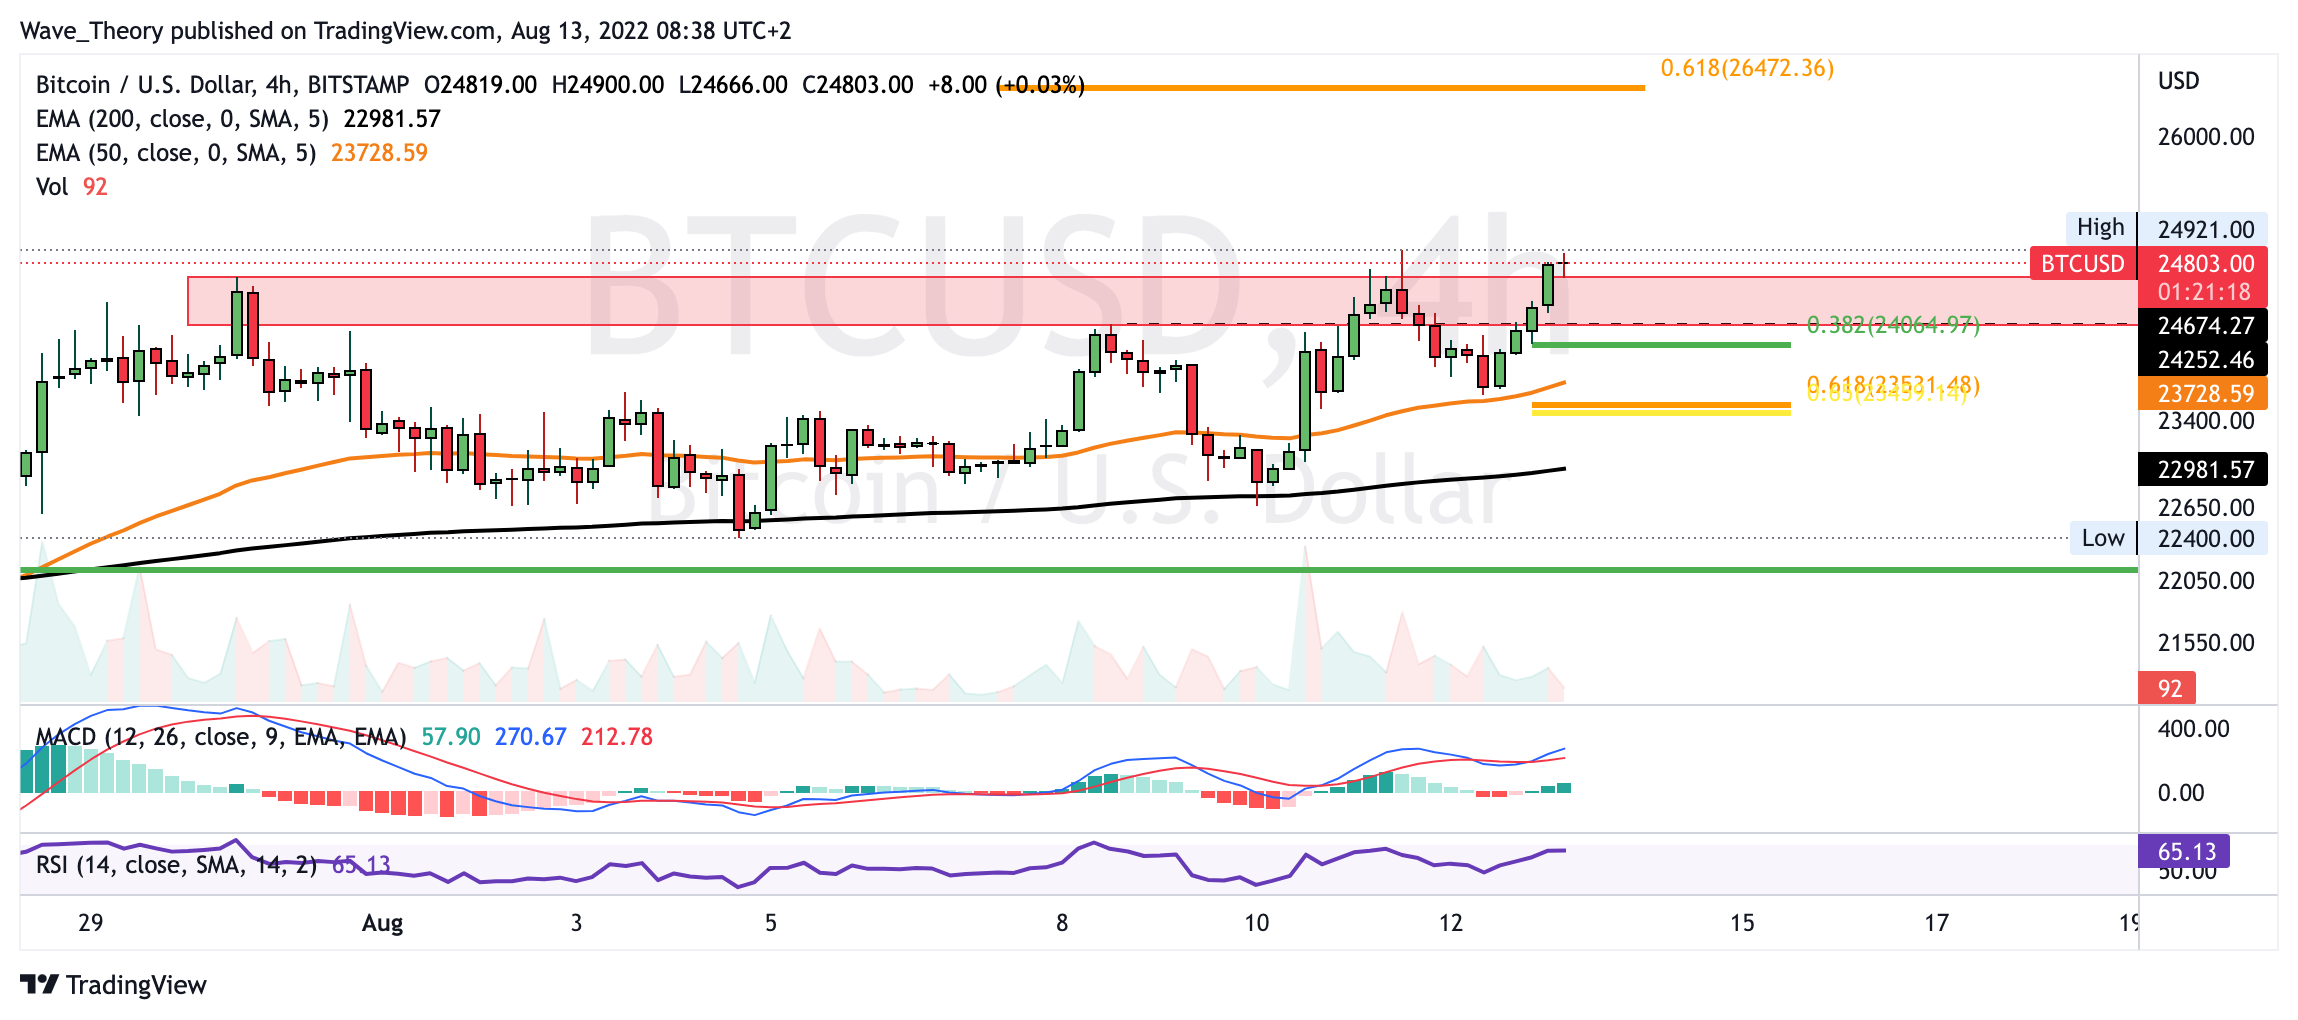
Even if Bitcoin still breaks the horizontal resistance, it could correct in the short term. He finds significant fib supports at $24,000 and $23,600. Otherwise, the EMAs are still in a golden crossover on the 4H chart, which confirms the trend bullish in the short term.
Will the Bitcoin price be rejected bearishly at around $ 26,800?
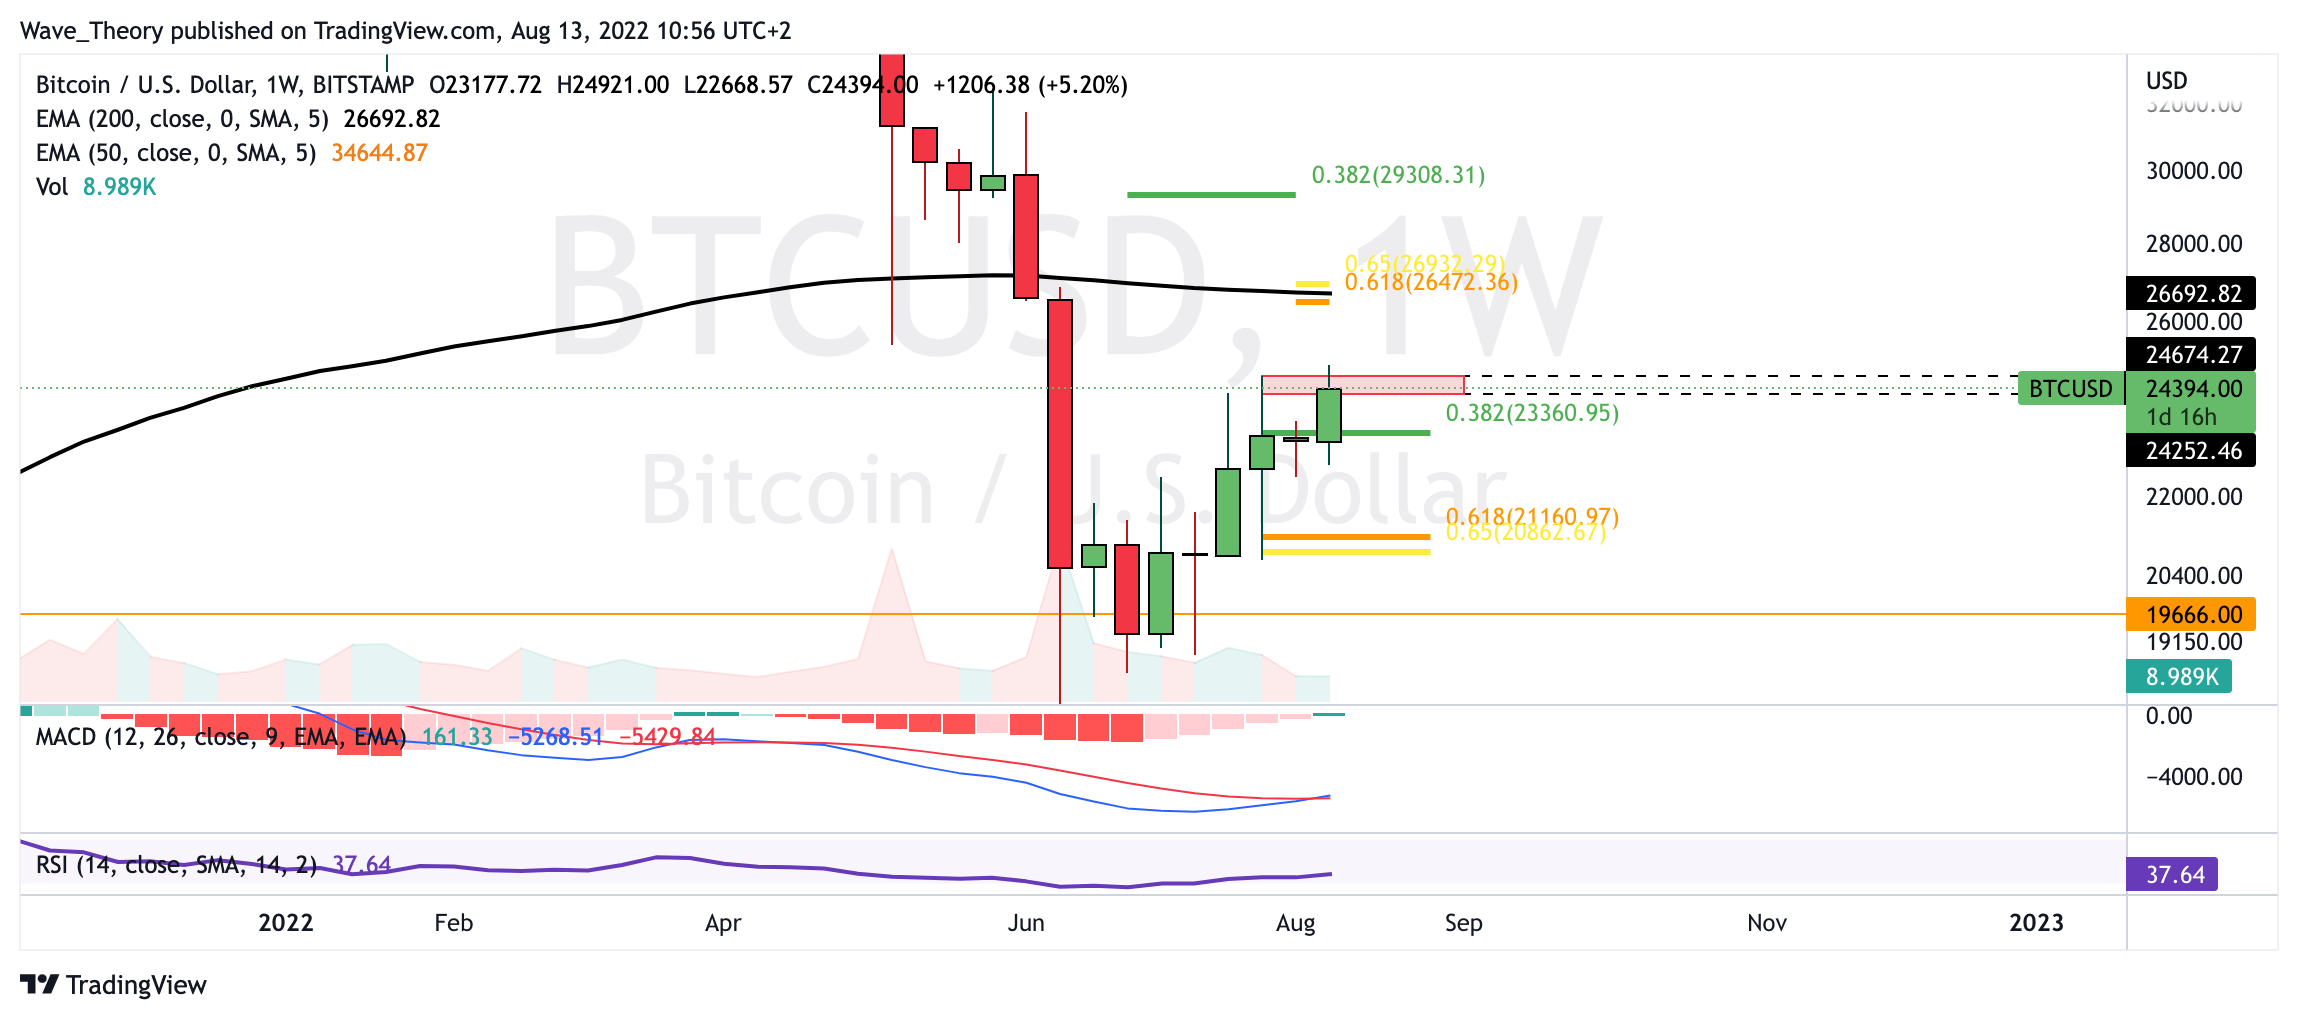
Will the Bitcoin price be rejected bearishly at the Golden Ratio resistance at around $ 26,800which additionally runs through the 200-week EMA, could correct Bitcoin to around $23,360 or even $21,150.
However, the MACD is still clearly bullish on the weekly chart and even if there is a correction on one of the Fibonacci supports mentioned, it still looks bullish in the medium term.
Is the BTC price closing above the 50-month EMA this month?
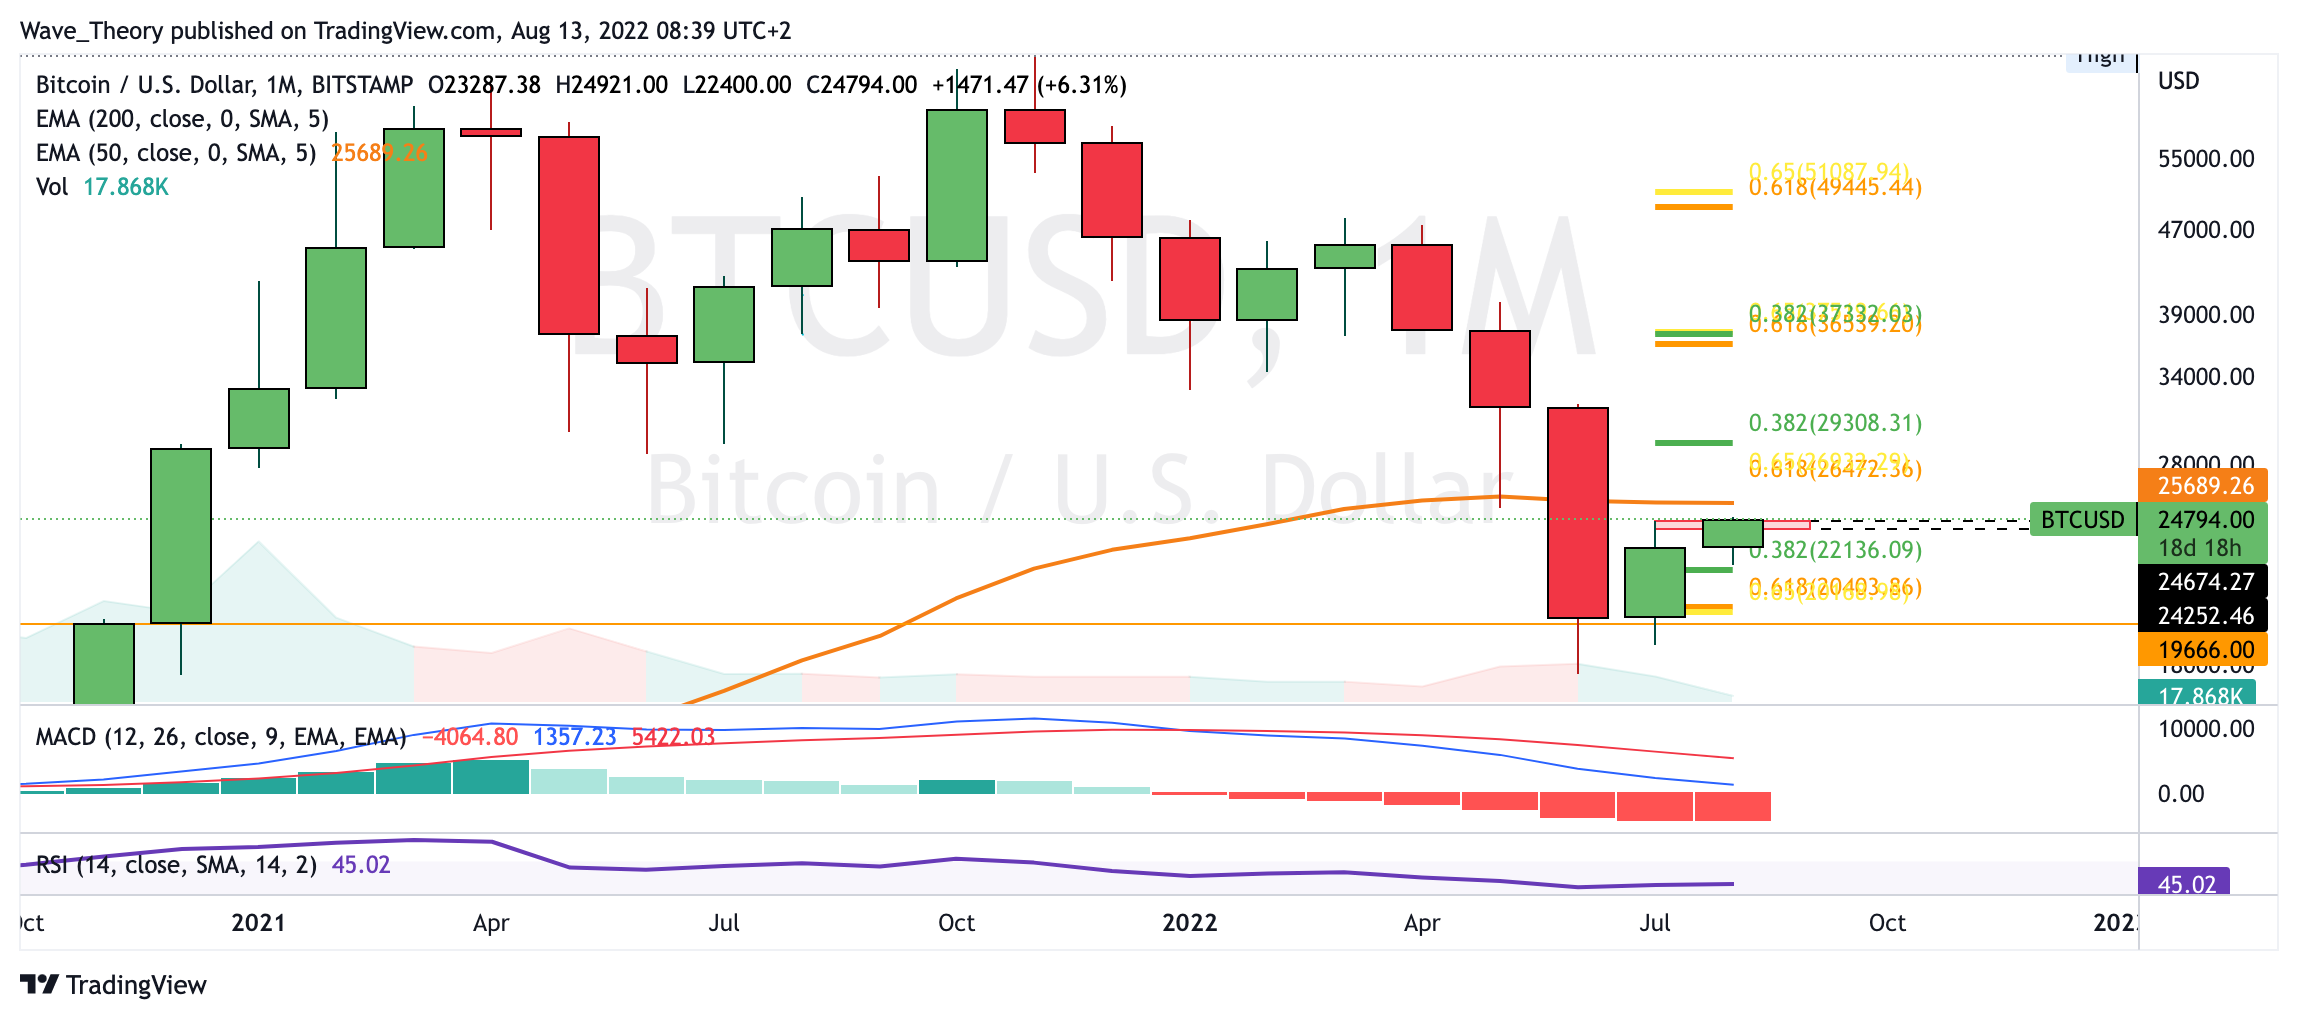
Important for a continued bullish course is a monthly closing price above the 50-month EMA at around $ 25,690. Thus, Bitcoin could target the Fibonacci resistance at around $ 37,000 in the following month.
However, the histogram of the MACD is still not ticking bullish higher and the MACD lines are still crossed bearishly, while the RSI is neutral.
The crypto market breaks out bullish and could rise around 20

The crypto market was able to break the Golden Ratio resistance at around $ 1.1 trillion. The next bullish price target is around $1.38 trillion at the 200-day EMA. This implies an upside potential of around 20%.
The MACD is bullish on the daily chart, because the histogram ticks bullish higher and the MACD lines are crossed bullish. On the downside, the crypto market finds support at around USD 1.05 trillion on the 50-day EMA.
For the last Bitcoin price forecast, click here.
Disclaimer
All information contained on our website is researched to the best of our knowledge and belief. The journalistic articles are for general information purposes only. Any action taken by the reader on the basis of the information found on our website is done exclusively at his own risk.