


Currently, the TRON price is struggling with the 200-day EMA at around $ 0.07, while the 50-day EMA at around $ 0.068 serves as support.
TRON price struggles with 200-day EMA resistance
The TRON price is currently giving mixed signals, with a bullish tendency. In the daily chart, the EMAs are still in a death cross, which confirms the trend in the short term. However, the EMAs are approaching and while the 50-day EMA at around $ 0.0684 serves as support, the 200-day EMA at around $ 0.07 acts as a significant resistance, against which TRON has already been rejected several times.
If the TRX price breaks the 200-day EMA bullish at around $ 0.07, the next significant Fibonacci resistance is waiting at around $ 0.075. In addition, the MACD’s histogram is ticking bullish higher, while the MACD lines are crossed bullish. The RSI is neutral and gives neither bullish nor bearish signals.
In the weekly chart, the TRX price is bullish
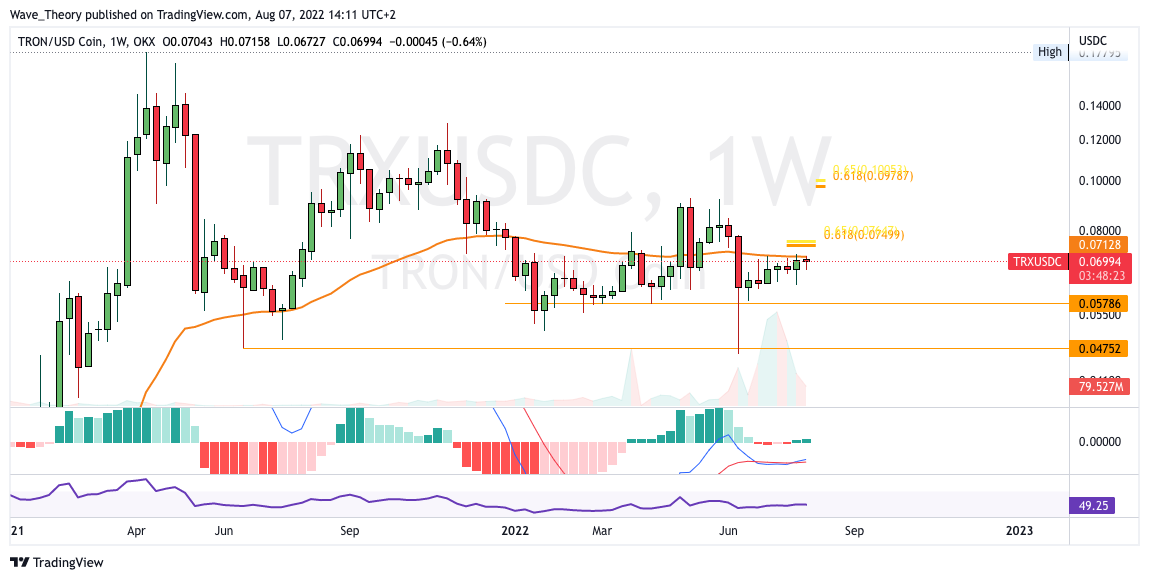
In addition, the 50-week EMA is located at around $ 0.0713, which also acts as a significant resistance. If TRON breaks this resistance and in the course of this also the Golden Ratio at around $ 0.075, the TRX price could rise to the next Fib resistance at around $ 0.1.
In addition, the histogram also ticks bullish higher in the weekly chart and the MACD lines are crossed bullish. In addition, the RSI also gives neither bullish nor bearish signals on the weekly chart.
TRON price closes higher for months
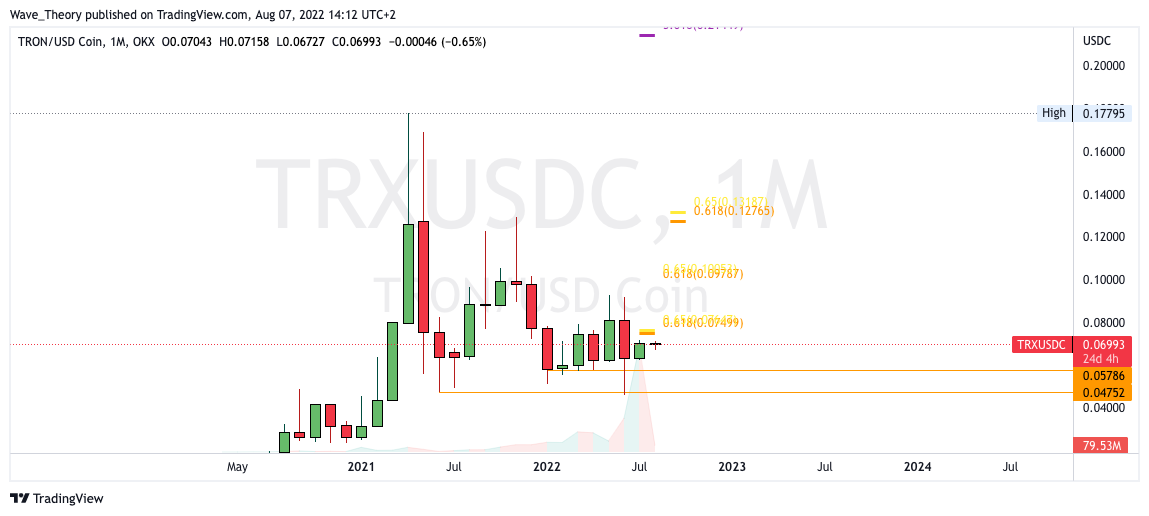
The monthly chart is really interesting, because the TRX price has been gradually closing higher for several months. The series of higher month-end prices basically indicates a bullish breakout. If TRON leaves the Golden Ratio at around $0.075 and $0.1, the decisive key resistance is waiting at around $0.13 before TRON is back in a new bull cycle.
TRON price is on the verge of a bullish breakout
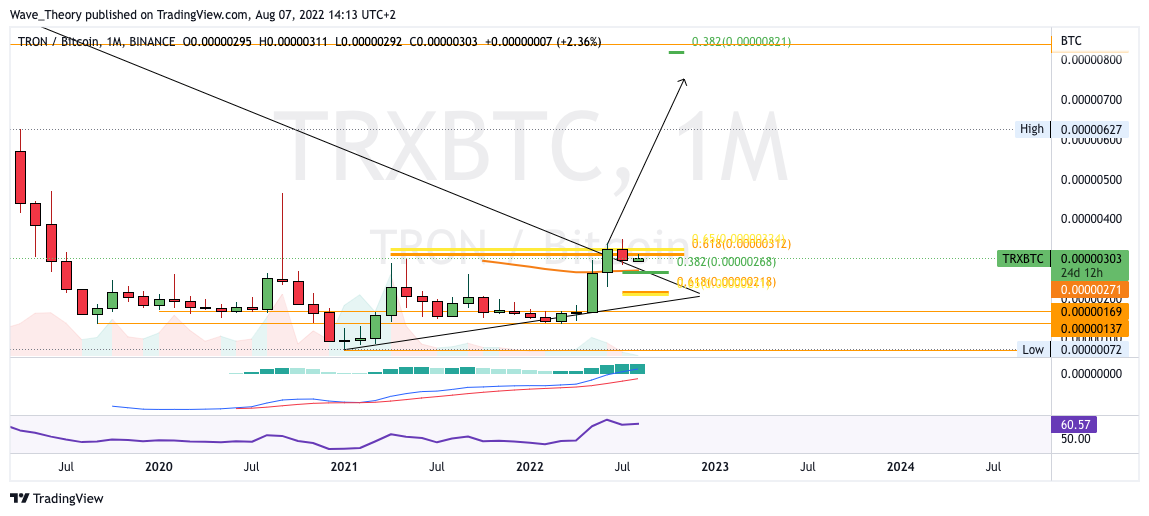
Against BTC, the TRON price is on the verge of a bullish breakout. Should TRON break the Golden Ratio at around 0.00000312 BTC, the next significant Fib resistance is waiting at around 0.00000821 BTC. In the event of a bullish breakout, the TRX price could almost triple. In addition, the MACD is clearly bullish on the monthly chart, because the MACD lines are crossed bullish and the histogram ticks bullish higher.
So far, however, TRON has been rejected bearishly at the Golden Ratio resistance at around 0.00000312 BTC and now finds significant support at the 50-month EMA at the 0.382 Fib level at around 0.0000027 BTC.
Disclaimer
All information contained on our website is researched to the best of our knowledge and belief. The journalistic articles are for general information purposes only. Any action taken by the reader on the basis of the information found on our website is done exclusively at his own risk.